

Account Analytics
The Account Analytics Indicator is a MetaTrader tool that transforms your account data into clear, visual graphs. It tracks both historical and real‑time metrics such as balance, equity, margin, free margin, margin level, drawdown, profit, deposits, and withdrawals. By plotting these values directly on your chart, it gives traders a transparent view of account health and performance trends, making risk management and strategy evaluation easier than ever.
Category : Utilities
Version : 2.3
Updated : 2026-02-10
Key Features
Description
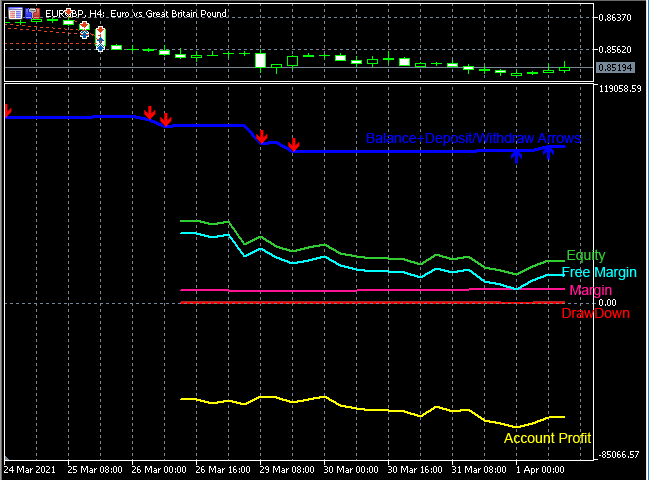
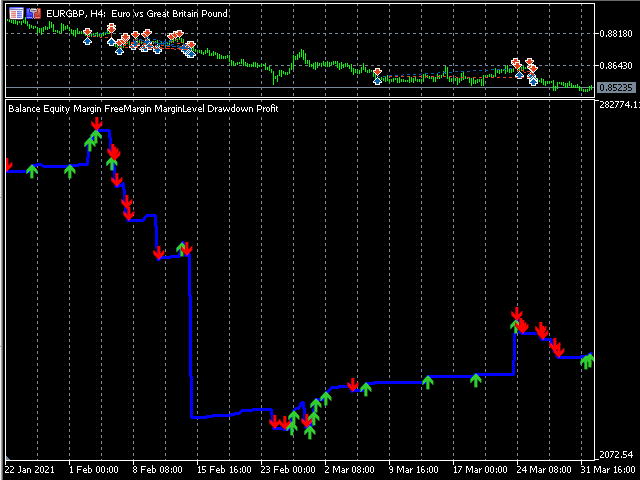
The Account Analytics Indicator is a powerful MetaTrader tool designed to give traders a clear, visual understanding of their account’s performance over time. By plotting graphs of key metrics such as balance, equity, margin, free margin, margin level, drawdown, profit, and even deposits and withdrawals, it transforms raw account data into easy‑to‑read visuals. Historical balance changes are displayed with arrows marking deposits and withdrawals, while real‑time monitoring captures equity, margin, and drawdown as they evolve during trading. This combination of historical and live data provides traders with a transparent view of their account health, helping them identify trends, evaluate strategies, and maintain discipline.
Beyond simple graphing, the Account Analytics Indicator offers flexible customization to suit different trading styles. Users can select which graphs to display, connect gaps in data for smoother visualization, and adjust line styles and colors for clarity. Drawdown signs can be marked on profit or loss graphs, making risk periods instantly recognizable. For advanced users and developers, buffers are accessible for integration with custom tools or automated systems. Whether you’re a beginner seeking transparency or a professional trader needing detailed analytics, Account Analytics serves as a reliable dashboard for monitoring account performance and managing risk effectively.
Usage Manual:
Step 1 – Attach Indicator
- Load Account Analytics onto any chart.
- Choose which graphs to display (balance, equity, margin, etc.) from the input settings.
Step 2 – Configure Inputs
These are the indicator input parameters:
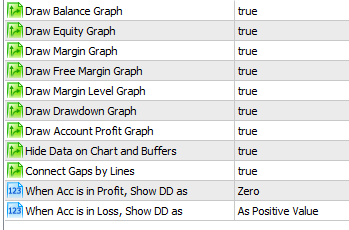
- Draw Balance Graph – shows historical balance with deposit/withdraw arrows.
- Draw Equity Graph – tracks equity in real time.
- Draw Margin Graph / Free Margin Graph – visualize margin usage and availability.
- Draw Margin Level Graph – monitor margin level trends.
- Draw Drawdown Graph – highlight drawdown periods.
- Draw Account Profit Graph – display profit history with DD signs.
- Hide Data on Chart and Buffers – toggle visibility.
- Connect Gaps by Lines – smooth out missing data points.
- Sign of DDs on Profit/Loss – mark drawdowns visually.
Step 3 – Customize Styles
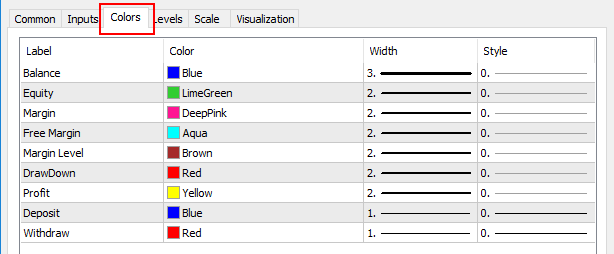
- Adjust graph styles (colors, thickness, line types) from the settings tab.
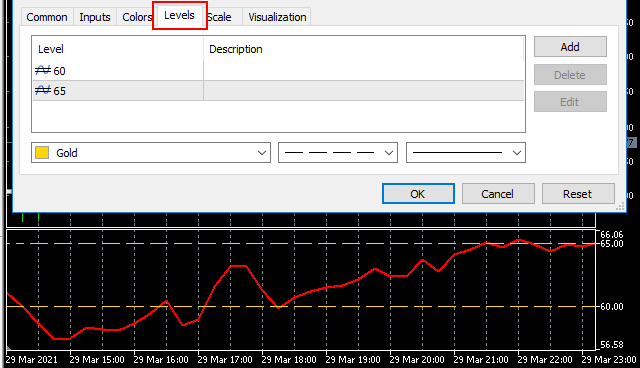
- Define levels if you need them.
Notes:
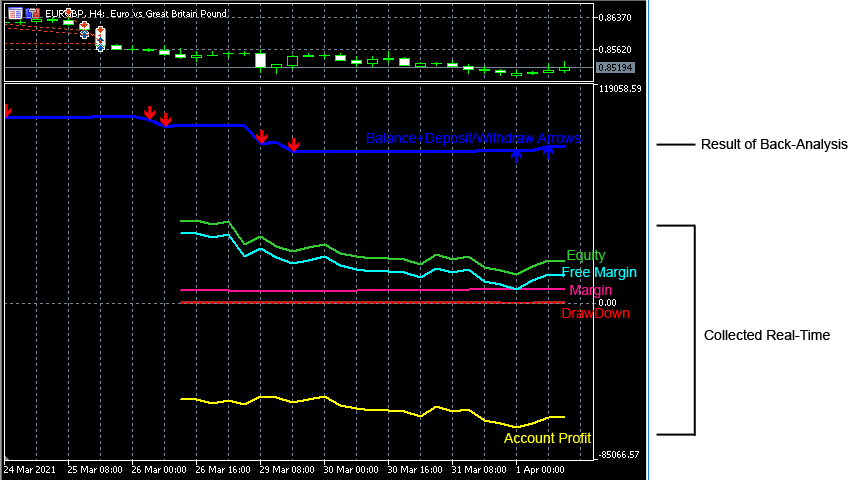
- Collecting Real-Time Data: (Important) The indicator generates historical balance graphs and marks deposits or withdrawals by analyzing past orders. However, metrics such as drawdown, equity, and margin require real‑time monitoring. Simply attach the indicator to a chart and allow it to collect live data as trading progresses.
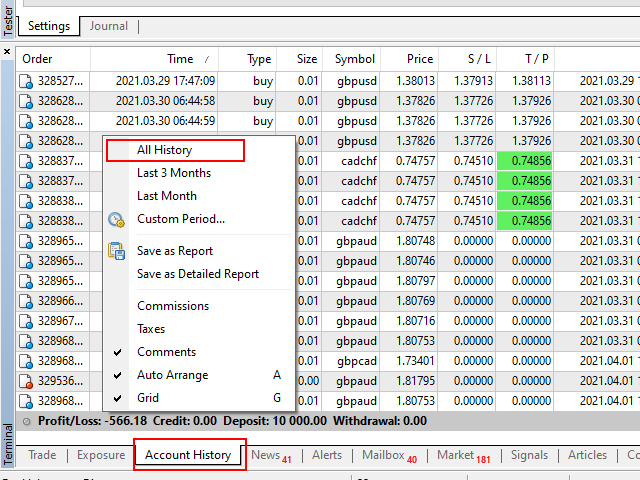
- Accessing Account History Data in MT4: By default, an EA cannot access the full account history unless permission is granted. To enable this, right‑click on the Account History panel and select All History.
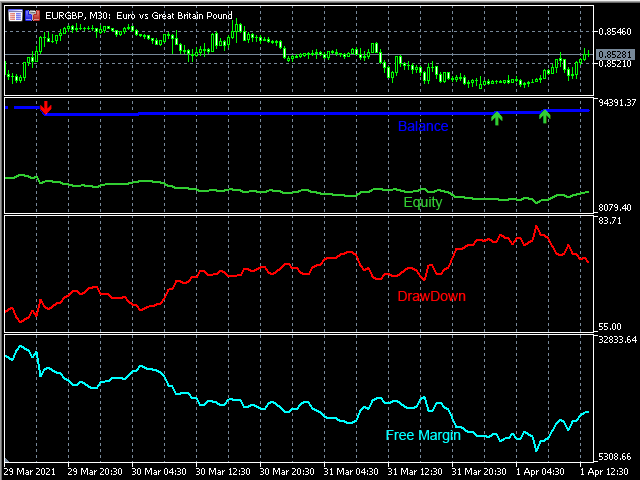
- For clearer visualization: The value ranges of different graphs are not uniform. To achieve a better view, it is recommended to attach multiple instances of the indicator to the chart and configure each one to display a separate graph in its own window. See the example below.
Need Help?
Here are some helpful resources. If you have questions or need assistance, feel free to contact us. You can submit a support ticket or leave a comment. we’ll respond as quickly as possible.
Screenshots
Pricing
New Offer Every 6 Hours up to 50%. Follow.
Testing is free. How to do?

Testing on Live
2 Days of unlimited testing
1 Account Activation
Full Support

3 Months
3 Months of unlimited use
5 Accounts Activation
Full Support
Free Updates
$ 30.00

6 Months
6 Months of unlimited use
10 Accounts Activation
Full Support
Free Updates
$ 40.00

Lifetime
Unlimited use, forever
20 Accounts Activation
VIP Support
Free Updates
$ 60.00
 to be a light for all traders.
I build automated strategies and want to integrate account performance data into my systems. I need access to buffers so I can use the indicator’s output programmatically. Does Account Analytics allow this?
Yes, Account Analytics exposes buffers that developers can access. This means you can pull balance, equity, margin, and drawdown data directly from the indicator and feed it into your custom tools or automated systems. It’s developer friendly and designed for integration.
Thanks for the tool. Drawdown visualization changed how I manage risk.
It’s my go‑to tool for account transparency.
Does it replace trading strategies?
No, it’s a monitoring tool, not a strategy.
I love seeing deposits and withdrawals marked on the chart.
I trade multiple accounts, and Account Analytics helps me track each one visually.
Account Analytics Indicator transformed how I view my trading accounts. Instead of relying on raw numbers, I now see balance, equity, margin, and drawdown plotted as graphs. Deposits and withdrawals are marked clearly, and real‑time monitoring ensures I never miss changes in equity or margin. It’s a professional tool that adds transparency and confidence to my trading.
This Indicator is the best visualization tool I’ve ever used in MetaTrader. Wide range of customization options helped me for better adjustment of graphics.
Account Analytics is lightweight and doesn’t slow down MetaTrader.
I manage multiple accounts, and I need a way to monitor each one without constantly switching between panels. Ideally, I’d like to attach an indicator to different charts and configure each to show specific metrics, like equity on one chart and drawdown on another. Is this possible with Account Analytics?
Yes, Account Analytics is flexible enough to handle multiple accounts or strategies. You can attach the indicator to different charts and configure each instance to display a specific graph. For example, one chart can show equity, another can show margin level, and another can track drawdown. This setup creates a dashboard‑like environment where you can monitor multiple accounts simultaneously.
The indicator feels professional and polished. It’s intuitive, reliable, and adds confidence to my trading.
The drawdown graph is my favorite feature. It shows me exactly when losses occur and how they affect overall performance. This keeps me disciplined and prevents me from ignoring risk.
I appreciate how deposits and withdrawals are marked with arrows. Thanks.
Does it work with all instruments?
Yes, it monitors account metrics regardless of whether you trade Forex, stocks, indices, or crypto.
It’s the dashboard MetaTrader was missing! Perfect.
hello,
Can I track profit trends?
Hi, Yes, profit graphs display account gains and losses with drawdown signs for clarity.
I use Account Analytics to monitor margin level trends. It’s essential for risk management.
The comments section is now open. Feel free to share your feedback, reviews, questions, and personal experience with the product. You can also interact with other users and join the discussion. Our support team is active there as well and will respond whenever assistance is needed.