

Market Profile
The Market Profile Indicator brings professional‑grade market analysis directly into MetaTrader. Originally developed as a way for traders to understand market structure without being on the trading floor, Market Profile organizes price and time into a clear, visual format.
With customizable histograms, session views, and advanced calculations like Point of Control (POC) and Value Area (VA), this tool helps traders identify support‑resistance zones, track intraday balance, and visualize order flow.
Category : Technical Indicators
Version : 4.2
Updated : 2026-05-25
Key Features
Description
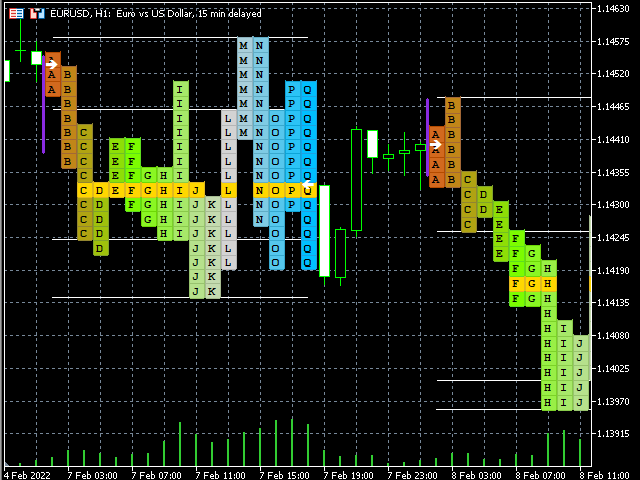
Market Profile is an advanced intra‑day charting technique that organizes market data into a clear structure:
- Price on the vertical axis
- Time and activity on the horizontal axis
This method was pioneered in the 1980s by J. Peter Steidlmayer at the Chicago Board of Trade. It gave traders a way to visualize where the market spends most of its time and volume, revealing balance zones, value areas, and breakout levels.
Unlike traditional candlestick charts, Market Profile shows the distribution of trading activity across price levels, helping traders see the “auction process” of the market. Whether you’re a beginner seeking clarity or a professional managing risk, Market Profile transforms raw data into actionable insights.
See similar products also:
Settings and Manual:
General Settings
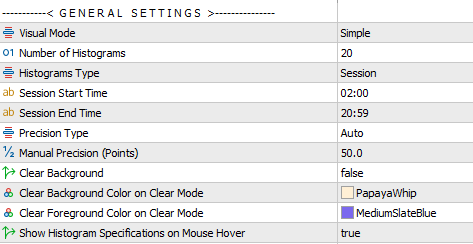
Visual Modes: Simple, Enhanced, Enhanced- Connected
Histogram Type: Session, Daily, Weekly, Monthly
Precision Type: Auto, Manual
Histogram Settings
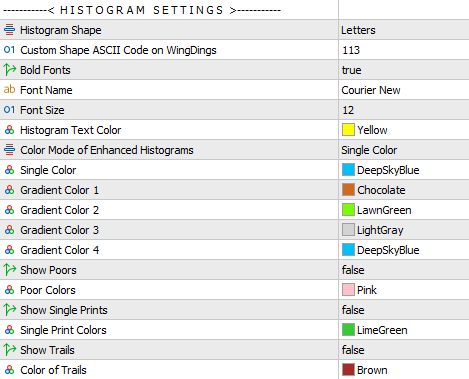
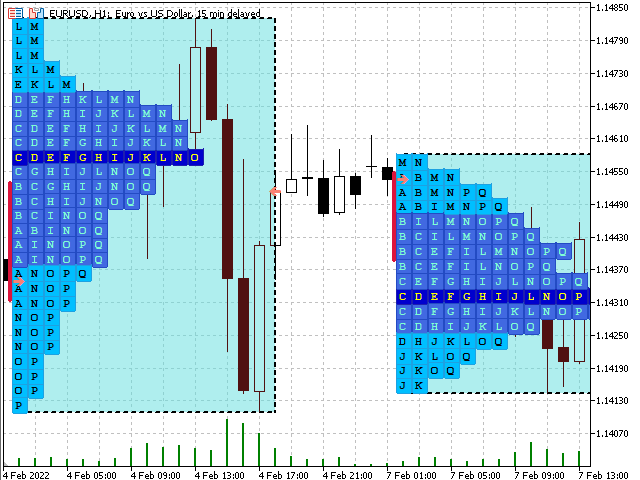
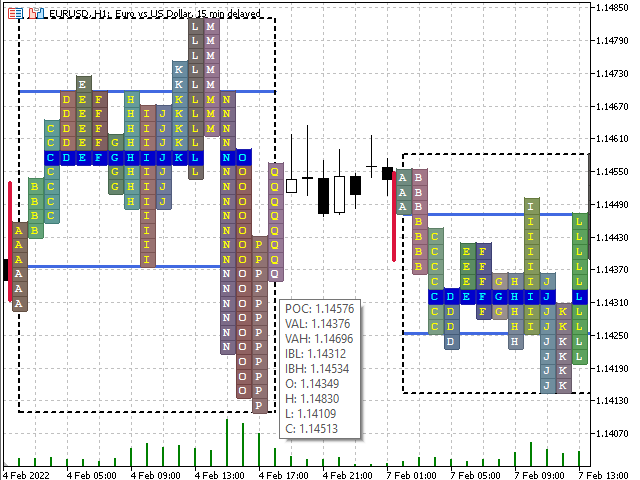
Histogram Type: Letters, Boxes, or Custom ASCII
Color Mode for Enhanced Histograms: Single, Random, Gradient
Settings for Poor, Single Prints, Trails are available also. For more details, scroll down to view the next section.
Bounding Box Settings
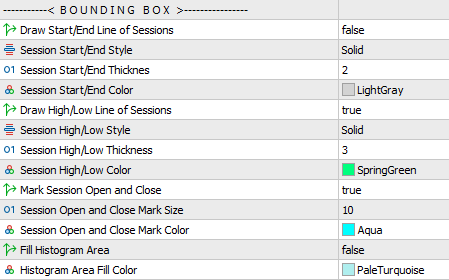
These are adjustment settings of bounding boxes of profiles.
VA Settings
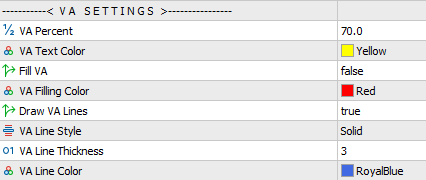
Configure Value Area percentage and settings. For more details, scroll down to view the next section.
POC Settings
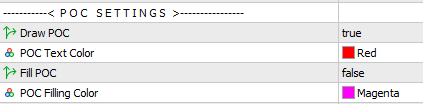
Adjust Point of Control display. For more details, scroll down to view the next section.
IB Settings
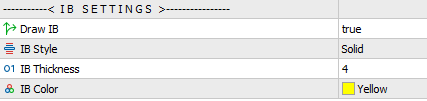
Define Initial Balance range. For more details, scroll down to view the next section.
Sample Settings and Templates:
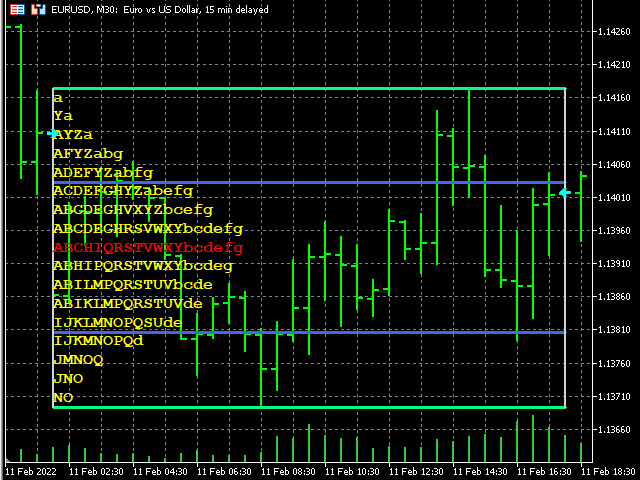
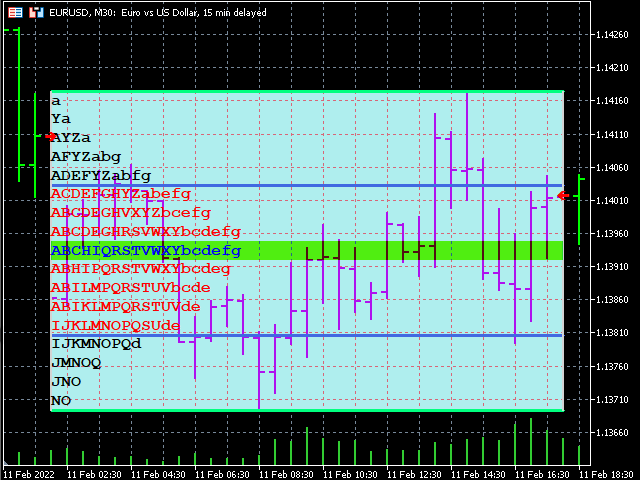
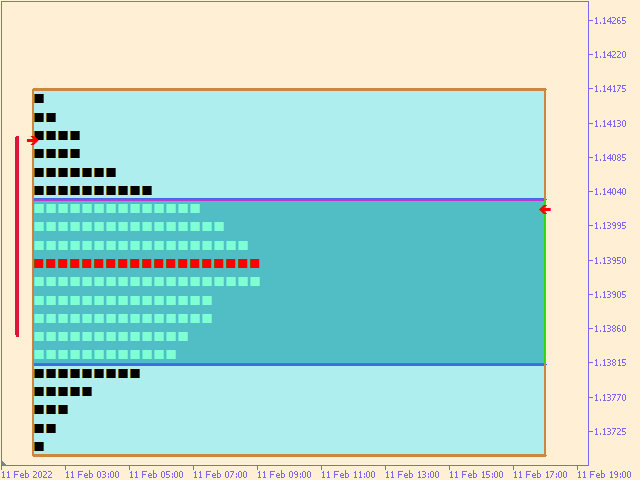
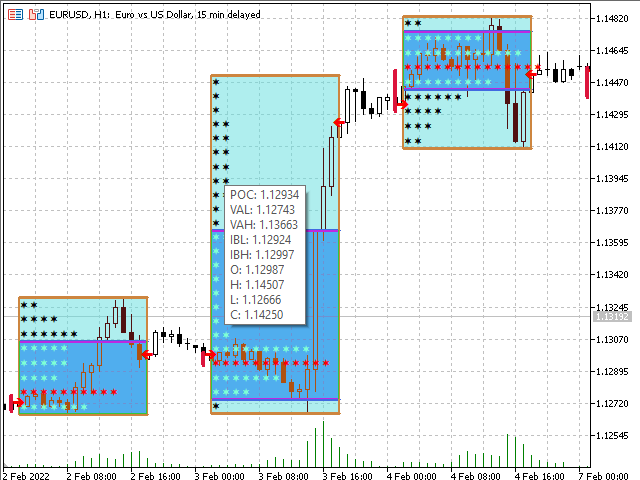
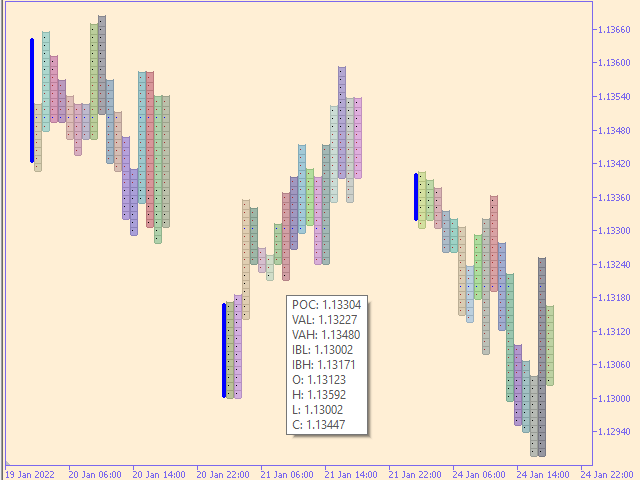
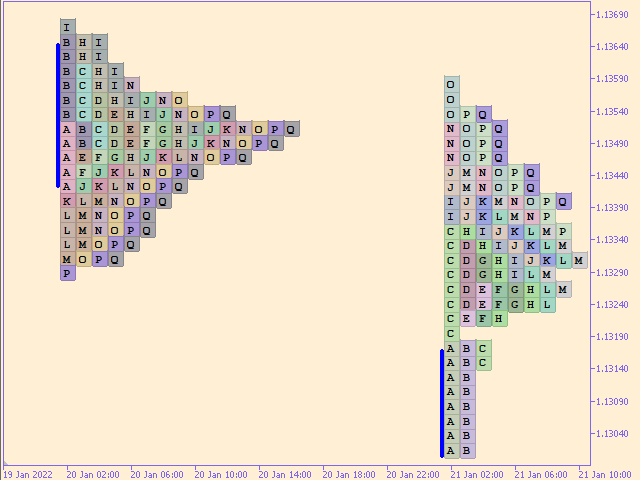
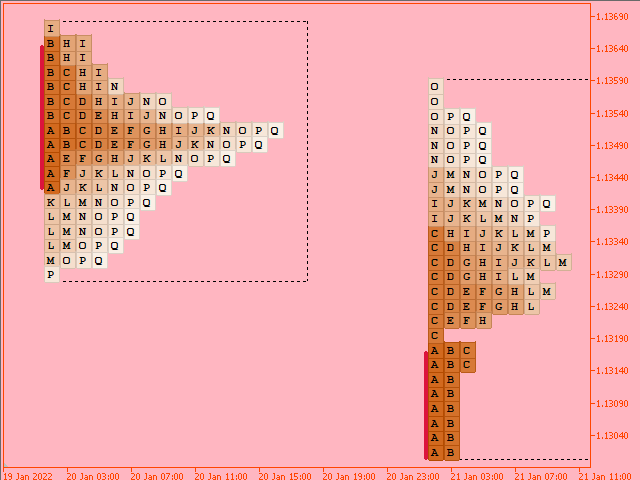
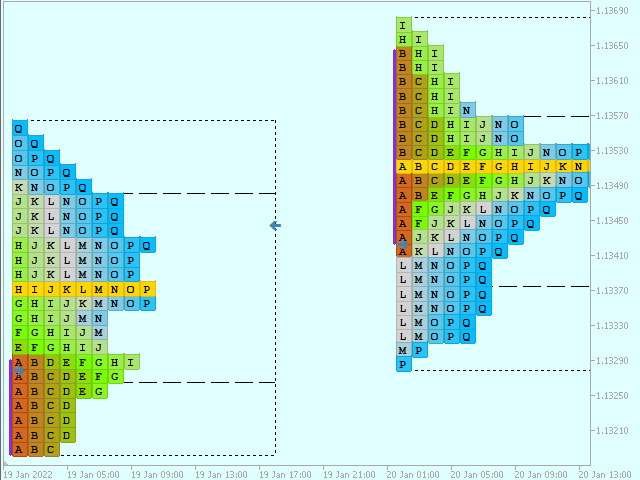
For user guidance and beginner support, we’ve included a collection of sample settings. These are available as downloadable .set files, which can be applied instantly by loading them into the indicator’s settings window. The outcomes of these templates are showcased in the Screenshots tab for easy preview. You can download a ZIP package containing all of these pre‑made settings in one place.
About Market Profile:
Introduction:
Market Profile is a professional charting technique that organizes market activity into a structured format, showing price on the vertical axis and time/activity on the horizontal axis. Developed in the 1980s by J. Peter Steidlmayer at the Chicago Board of Trade, it was designed to help traders understand the auction process of the market without needing to be physically present on the trading floor.
Unlike traditional candlestick charts, Market Profile reveals how much time and volume the market spends at each price level. This distribution highlights value areas, balance zones, and breakout levels, giving traders a clearer picture of market sentiment and structure.
Usage Scenarios:
- Intraday Traders: Use session profiles to track Asia, London, and New York activity.
- Swing Traders: Apply weekly or monthly profiles to identify long‑term balance zones.
- Breakout Traders: Watch IB and Poors for potential breakout opportunities.
- Institutional Style: Replicate auction market theory for deeper market understanding.
Value Area (VA):
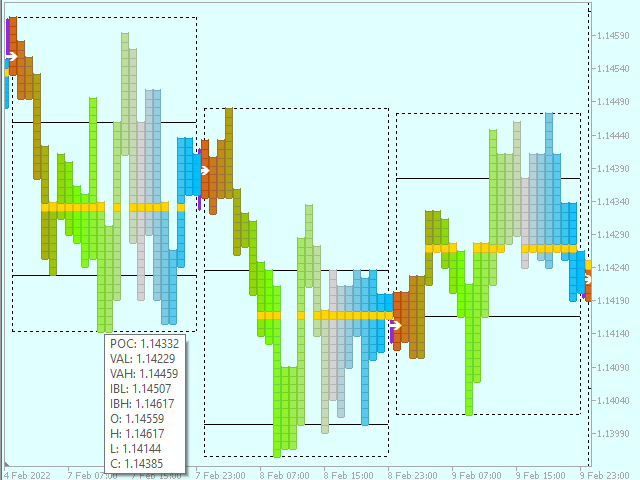
- The Value Area represents the price range where approximately 70% of trading activity occurs during a session.
- It shows where the market is most comfortable and balanced.
- Usage: Traders use VA to identify potential support and resistance zones. If price moves outside VA, it often signals imbalance and possible trend continuation.
Point of Control (POC):
- The POC is the single price level with the highest traded activity (most time or volume).
- It acts as the “fair price” where buyers and sellers agree most.
- Usage: POC often becomes a magnet for price action. Markets tend to revisit POC levels, making them key reference points for entries and exits.
Initial Balance (IB):
- The IB is the range established during the first hour of trading (two 30‑minute periods in Market Profile).
- It sets the tone for the day, showing early conviction between buyers and sellers.
- Usage:
- Narrow IB → suggests balance and low volatility.
- Wide IB → indicates strong conviction and potential trend day.
- Breakouts beyond IB often signal directional moves.
Poors (Poor Highs & Poor Lows):
- Poor High: Occurs when the market makes a high but fails to show excess (no strong rejection). Price revisits the same high across multiple periods.
- Poor Low: The opposite — a weak bottom where price revisits the same low without strong rejection.
- Usage: Poors are considered unfinished business. The market often returns to these levels later to “repair” them, making them short‑term reference points.
Single Prints:
- Single Prints are thin areas in the profile where only one TPO (time‑price opportunity) occurs.
- They represent low volume zones created during fast directional moves.
- Usage: Single Prints often act as support/resistance markers. If revisited, they may fill in, showing balance restoration.
Trails:
- Trails are extended ranges in the profile that show where price has moved beyond balance.
- They highlight trend continuation zones where the market pushes outside the Value Area.
- Usage: Trails help traders spot developing trends and areas where momentum is strong.
Buffers for Developers:
Developers can integrate the available buffers into custom dashboards, indicators, or Expert Advisors. The following table lists the buffer numbers along with their corresponding contents.
| Buffer Index | Shift Value | Description |
|---|---|---|
| 0 | 0 ~ n-1 | Value Area Low |
| 1 | 0 ~ n-1 | Value Area High |
| 2 | 0 ~ n-1 | Point of Control |
| 3 | 0 ~ n-1 | Profile Low |
| 4 | 0 ~ n-1 | Profile High |
| 5 | 0 ~ n-1 | Profile Open |
| 6 | 0 ~ n-1 | Profile Close |
| 7 | 0 ~ n-1 | Initial Balance Low |
| 8 | 0 ~ n-1 | Initial Balance Low |
| 9 | 0 ~ n-1 | Number of Rows on Profile |
| 10 | 0 ~ n-1 | Start Time of Profile |
| 11 | 0 ~ n-1 | End Time of Profile |
| 12 | 0 ~ m-1 | Price Arrays of Latest Profile |
| 13 | 0 ~ m-1 | Values of Latest Profile |
Notes :
n = Total number of profiles (corresponds to the number of histograms defined in the inputs).
m = Number of rows in the most recent profile (corresponds to Buffer No. 9).
Profile specifications are accessible for all profiles. However, detailed data — such as price arrays and values at each price level — is available only for the latest profile
Examples and Code Snippets:
VAL=iCustom(Symbol(),Period(),"Market Profile MT4",.....inputs......,0,n);
VAH=iCustom(Symbol(),Period(),"Market Profile MT4",.....inputs......,1,n);
POC=iCustom(Symbol(),Period(),"Market Profile MT4",.....inputs......,2,n);
HistoLow=iCustom(Symbol(),Period(),"Market Profile MT4",.....inputs......,3,n);
HistoHigh=iCustom(Symbol(),Period(),"Market Profile MT4",.....inputs......,4,n);
HistoOpen=iCustom(Symbol(),Period(),"Market Profile MT4",.....inputs......,5,n);
HistoClose=iCustom(Symbol(),Period(),"Market Profile MT4",.....inputs......,6,n);
HistoIBL=iCustom(Symbol(),Period(),"Market Profile MT4",.....inputs......,7,n);
HistoIBH=iCustom(Symbol(),Period(),"Market Profile MT4",.....inputs......,8,n);
m=iCustom(Symbol(),Period(),"Market Profile MT4",.....inputs......,9,n);
StartTime=(datetime)iCustom(Symbol(),Period(),"Market Profile MT4",.....inputs......,10,n);

EndTime=(datetime)iCustom(Symbol(),Period(),"Market Profile MT4",.....inputs......,11,n);m=iCustom(Symbol(),Period(),"Market Profile MT4",.....inputs......,9,0);
for( i=0; i<m; i++)
{
Price[i]=iCustom(Symbol(),Period(),"Market Profile MT4",.....inputs......,12,i);
Value[i]=iCustom(Symbol(),Period(),"Market Profile MT4",.....inputs......,13,i);
}int handleMP=iCustom(Symbol(),Period(),"Market Profile MT5",.....inputs......);
if( handleMP==INVALID_HANDLE ) Print("Invalid Handle for Indicator. Err : ",GetLastError());
int nbuf;
nbuf=CopyBuffer(handleMP,0,0,n,VAL); if( nbuf!=n ) Print("Copy Buffer Err : ",GetLastError());
nbuf=CopyBuffer(handleMP,1,0,n,VAH); if( nbuf!=n ) Print("Copy Buffer Err : ",GetLastError());
nbuf=CopyBuffer(handleMP,2,0,n,POC); if( nbuf!=n ) Print("Copy Buffer Err : ",GetLastError());
nbuf=CopyBuffer(handleMP,3,0,n,HistoLow); if( nbuf!=n ) Print("Copy Buffer Err : ",GetLastError());
nbuf=CopyBuffer(handleMP,4,0,n,HistoHigh); if( nbuf!=n ) Print("Copy Buffer Err : ",GetLastError());
nbuf=CopyBuffer(handleMP,5,0,n,HistoOpen); if( nbuf!=n ) Print("Copy Buffer Err : ",GetLastError());
nbuf=CopyBuffer(handleMP,6,0,n,HistoClose); if( nbuf!=n ) Print("Copy Buffer Err : ",GetLastError());
nbuf=CopyBuffer(handleMP,7,0,n,HistoIBL); if( nbuf!=n ) Print("Copy Buffer Err : ",GetLastError());
nbuf=CopyBuffer(handleMP,8,0,n,HistoIBH); if( nbuf!=n ) Print("Copy Buffer Err : ",GetLastError());
nbuf=CopyBuffer(handleMP,9,0,n,m); if( nbuf!=n ) Print("Copy Buffer Err : ",GetLastError());
nbuf=CopyBuffer(handleMP,10,0,n,StartTime); if( nbuf!=n ) Print("Copy Buffer Err : ",GetLastError());
nbuf=CopyBuffer(handleMP,11,0,n,EndTime); if( nbuf!=n ) Print("Copy Buffer Err : ",GetLastError());int handleMP=iCustom(Symbol(),Period(),"Market Profile MT5",.....inputs......);
if( handleMP==INVALID_HANDLE ) Print("Invalid Handle for Indicator. Err : ",GetLastError());
int nbuf;
nbuf=CopyBuffer(handleTPO,9,0,1,mbuf); if( nbuf!=1 ) Print("Copy Buffer Err : ",GetLastError());
m=mbuf[0];
nbuf=CopyBuffer(handleMP,12,0,m,Price); if( nbuf!=m ) Print("Copy Buffer Err : ",GetLastError());
nbuf=CopyBuffer(handleMP,13,0,m,Value); if( nbuf!=m ) Print("Copy Buffer Err : ",GetLastError()); Need Help?
Here are some helpful resources. If you have questions or need assistance, feel free to contact us. You can submit a support ticket or leave a comment. we’ll respond as quickly as possible.
Screenshots
Pricing
New Offer Every 6 Hours up to 50%. Follow.
Testing is free. How to do?

6 Months
6 Months of unlimited use
3 Accounts Activation
Full Support
Free Updates
$ 30.00

1 Year
1 Year of unlimited use
4 Accounts Activation
Full Support
Free Updates
$ 45.00

Lifetime
Unlimited use, forever
5 Accounts Activation
VIP Support
Free Updates
$ 60.00
 to be a light for all traders.
The customizable visuals are a huge plus. I can switch between Simple, Pretty Normal, and Pretty Linked modes depending on my needs.
How do I know if the market is balanced or imbalanced?
A balanced market shows wide Value Areas and overlapping profiles. Imbalance occurs when price moves outside the Value Area or breaks beyond the Initial Balance, often signaling trend continuation.
Can Market Profile help me understand institutional activity?
Yes. Weekly and monthly profiles often reveal where large players are active. Value Areas and POC levels highlight zones of heavy participation, giving traders insight into institutional footprints.
I’ve doubled my confidence in entries since using Market Profile.
Perfect. Using this indicator we can visualize algorithmic signals directly on the profile.
A good indicator. I like it.
The buffers for programmers let me integrate Market Profile into my automated systems.
I’ve traded for years, but this indicator makes session analysis effortless.
How can I adjust the settings to display the result same as attached screenshots? Can everyone share me the settings?
The settings file for all attached screenshots are available here.
The gradient color option makes the profiles look professional.
Can I use Market Profile for swing trading, or is it only for intraday?
Market Profile works across multiple timeframes. You can analyze sessions for intraday trades, or use weekly and monthly profiles to identify long‑term balance zones and institutional activity.
Does Market Profile work on all instruments?
Yes. Market Profile can be applied to Forex, indices, commodities, and even cryptocurrencies. As long as there’s price and time data, the indicator can build profiles.
I’ve stopped guessing support zones. Market Profile highlights them clearly. Thanks for the product.
As a developer, I appreciate how Market Profile exposes buffers for programmers. I’ve integrated profile data into my automated strategies, and the results are impressive. I can calculate custom metrics beyond the built‑in ones, and the ASCII histogram shapes let me design unique chart styles. Market Profile bridges the gap between coding and trading, giving me both flexibility and precision.
I use the ASCII option to create custom visual markers. It is a perfect visual view.
Market Profile taught me to see the market as an auction. The Initial Balance shows me the day’s tone, the Value Area highlights where most trading occurs, and Poors remind me of unfinished business. These concepts used to be abstract, but now they’re visual and actionable. My trading has become more structured, and I finally feel like I’m trading with the market instead of against it.
The screenshots helped me understand how profiles look. Very beginner friendly.
Market Profile is the closest thing to floor trader analysis I’ve seen in MetaTrader.
I combine Market Profile with moving averages. It is powerful setup. I recommend it.
If you’d like, you can share the details here so other traders can benefit from them as well.
Hi, I didn’t realize how often price revisits Poors until I saw them highlighted.
That’s the auction theory in action. Poors represent unfinished business, and the market often returns to repair them
Market Profile finally gives me the clarity I needed to see balance zones in real time.
The comments section is now open. Feel free to share your feedback, reviews, questions, and personal experience with the product. You can also interact with other users and join the discussion. Our support team is active there as well and will respond whenever assistance is needed.