

Fundamental Analysis Dashboard
Fundamental Analysis Dashboard is a panel‑style EA (Market Scanner) that supports multiple symbols and timeframes, presenting signals and trends in a clear tabular format directly on the chart. Built on the technical foundation of the ‘Fundamental Analysis Signals’ indicator — a non‑repaint MetaTrader tool designed to detect and forecast large‑scale market movements with precision — the dashboard provides traders with reliable insights. In addition, it displays a summary of all open positions and offers convenient trade‑closing options, making it a comprehensive solution for monitoring and managing market activity.
Category : Utilities, Market Scanners
Version : 3.1
Updated : 2026-04-05
Key Features
Description
We developed a panel that is simple to set up and easy to use, providing clear guidance for traders of all levels — from beginners to professionals. The dashboard combines signals across multiple timeframes and presents an overall summary, helping traders make faster and more confident decisions.
It also displays the properties of open trades and includes a quick‑close function for efficient management. An integrated alerting system and Telegram notifications ensure traders never miss important market developments.
For deeper insights, including historical trends of each symbol and timeframe, and to validate dashboard signals against past data, please refer to the Fundamental Analysis Signals indicator.
See Also:
Usage Manual:
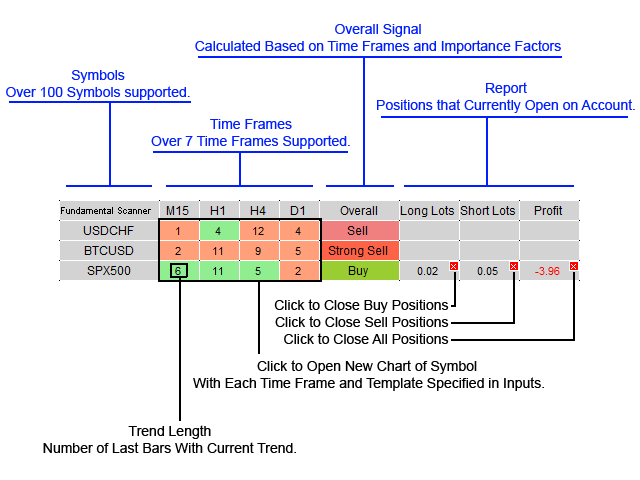
The image below highlights and explains the different parts of the panel.
Below is the list of input parameters available in the EA:
General Settings:
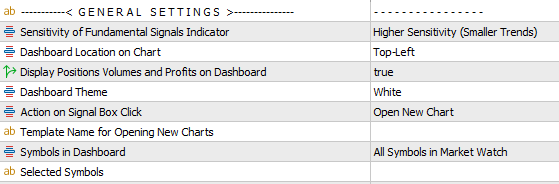
- Sensitivity of Signals: Choose between High, Medium, or Low sensitivity, identical to the Fundamental Analysis Signals indicator.
- Dashboard Location: Position the panel anywhere on the chart — Top‑Right, Top‑Left, Bottom‑Right, Bottom‑Left, or Center.
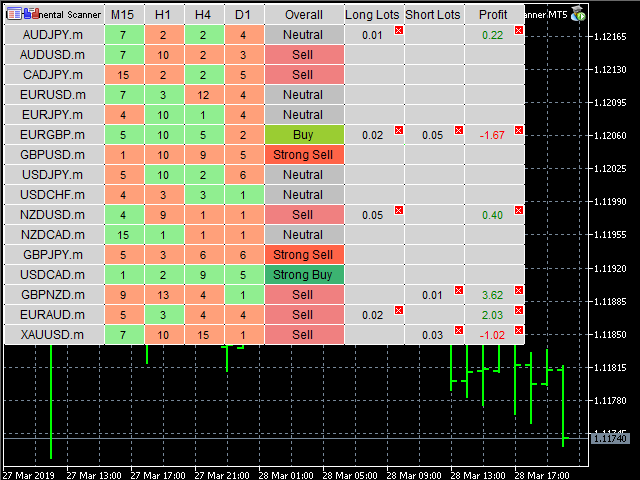
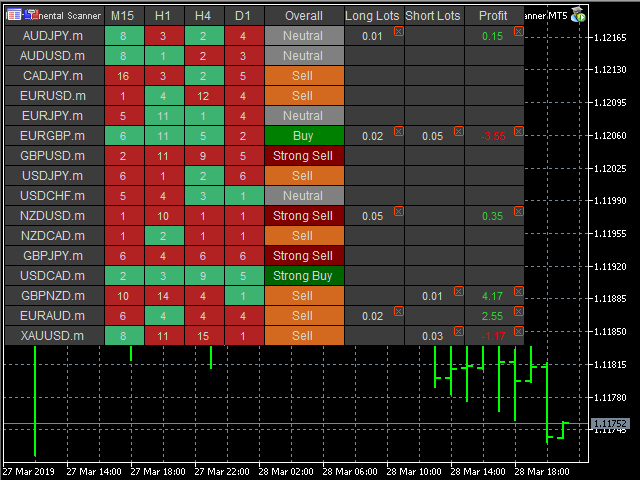
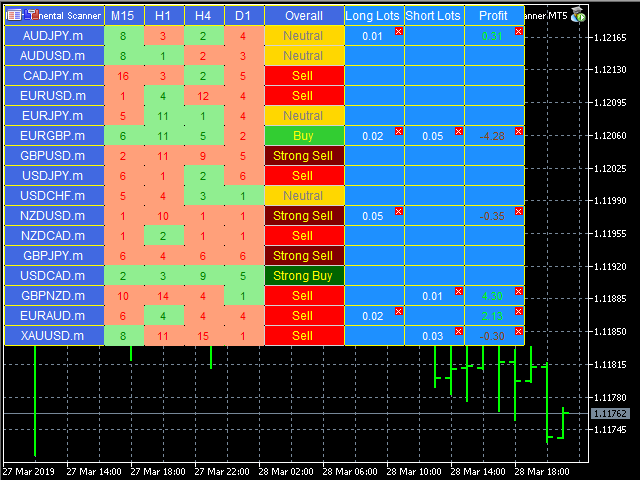
- Display Trade Summary: When enabled, three extra columns appear showing Long Lots, Short Lots, and Total Profit for open trades.
- Dashboard Theme: Select from White, Black, or Colorful themes.
- Action on Signal Box Click: Define what happens when clicking a cell — open a new chart, change the current chart, or do nothing.
- Template for New Charts: If opening new charts is enabled, specify a template to apply (optional).
- Symbols in Dashboard: Choose to display all Market Watch symbols or only those defined in the next parameter.
- Selected Symbols: Enter a comma‑separated list of specific symbols to include.
Timeframes:
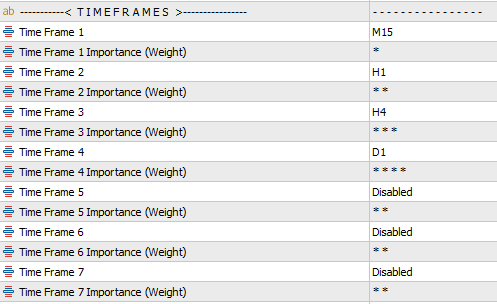
Up to seven timeframes are available for selection and customization. Each timeframe can be chosen from a dropdown list, or set to Disabled if you prefer not to display it on the panel. Another configurable parameter is the Importance of each timeframe, which can be rated from 1 to 5 stars. The EA then calculates the overall signal by weighting these importance factors, and presents the result as one of five categories: Strong Sell, Sell, Neutral, Buy, or Strong Buy.
Notifications:
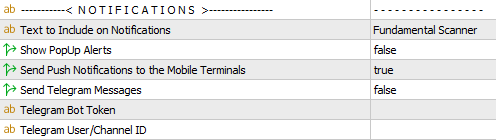
In this section, you can configure notification settings. Options include enabling pop‑up alerts, mobile notifications on MetaTrader terminals, or Telegram messages sent to a group, channel, or chat.
Notes:
- This tool is not an indicator — it is a utility classified under Expert Advisors, capable of closing positions. Please ensure the downloaded file is placed in the correct folder:
MQLx\experts. - For setting up Telegram notifications, refer to the dedicated setup page.
- To verify and validate signals historically, you can test the Fundamental Analysis Signals indicator, which uses the same signal engine as this EA.
- There is no need to purchase a separate license for the Fundamental Analysis Signals indicator — it is already integrated.
Need Help?
Here are some helpful resources. If you have questions or need assistance, feel free to contact us. You can submit a support ticket or leave a comment. we’ll respond as quickly as possible.
Screenshots
Pricing
New Offer Every 6 Hours up to 50%. Follow.
Testing is free. How to do?

1 Month
1 Month of unlimited use
1 Account Activation
Full Support
Free Updates
$ 30.00

3 Months
3 Months of unlimited use
2 Accounts Activation
Full Support
Free Updates
$ 50.00

6 Months
6 Months of unlimited use
3 Accounts Activation
Full Support
Free Updates
$ 70.00

1 Year
1 Year of unlimited use
4 Accounts Activation
Full Support
Free Updates
$ 90.00

Lifetime
Unlimited use, forever
5 Accounts Activation
VIP Support
Free Updates
$ 110.00
 to be a light for all traders.
The instructions need more detail, otherwise beginners will confuse.
We have incorporated additional details and explanations. Please review and inform us if further clarification is required.
Color coded signals make trends obvious at a glance.
Why oversell the clarity of signals when they still require interpretation?
The signals are weighted outputs, not absolute truths. While they simplify analysis, they don’t eliminate the need for trader judgment. Marketing language should better reflect this reality.
I used to juggle charts endlessly. Now, everything is in one place, signals, alerts, and trade management. It’s a complete solution.
I’ve noticed that this EA is categorized under Expert Advisors rather than indicators. Can you explain why this distinction matters, and what practical difference it makes for traders when installing and using the tool?
Great observation. Unlike indicators, which only display signals or visual cues, Expert Advisors (EAs) can actively manage trades — including opening, modifying, and closing positions. This EA is designed as a utility that not only scans multiple timeframes and symbols but also allows you to close trades directly from the panel. That’s why it must be installed in the
MQLx\expertsfolder, not the indicators folder. This distinction ensures the EA has the necessary permissions to interact with your trading account.I wish there was a way to export signals directly into reports.
Hi, Can you explain your idea more?
I mean to access the signals from another robots.
This product can’t do that directly, but you can use the Fundamental Analysis Signals Indicator instead. Its signals are identical to this one, and you can access them through another robot or indicator using its buffers.
I struggled with setting up Telegram notifications. The instructions felt vague, and I wasted a lot of time trying to connect my account. Why isn’t there a more user‑friendly setup process, and what improvements are planned?
You’re right. Telegram setup can be tricky, especially for users unfamiliar with API tokens and bot creation. Currently, the EA requires manual configuration, which isn’t beginner‑friendly. We added a clearer step‑by‑step documentation with screenshots to guide users through the process. You can find it here.
Thank you for your fast help and support.
Do I need to install the fundamental indicator also?
No. It is not needed. The indicator is embedded inside the dashboard and works interdependently.
It is perfect. Thanks.
Signals are accurate, alerts are instant. I feel in control.
Hello. Can I rely on the overall signal (Strong Sell, Sell, Neutral, Buy, Strong Buy) as a standalone trading strategy?
Hello. The overall signal is a weighted calculation based on your selected timeframes and importance ratings. While it provides a clear directional bias, it should be used as part of a broader trading plan that includes risk management, fundamental context, and technical confirmation. It’s a guide, not a guarantee.
The EA integrates the Fundamental Analysis Signals indicator. How does this benefit traders compared to using the indicator separately?
By embedding the signal engine directly into the EA, traders don’t need to purchase or install the indicator separately. This ensures seamless compatibility, reduces setup time, and guarantees that the signals used for trade management are consistent with the analysis engine. It’s a built‑in advantage that simplifies the workflow.
The ability to customize timeframes and assign importance factors is brilliant. I can tailor the signals to my style, and the color‑coded panel makes trends obvious at a glance.
I love how the dashboard shows open trade properties and lets me close positions instantly. It saves me time and keeps me focused on strategy instead of manual tasks.
I like the EA. The panel is informative, though it takes up too much chart space. A compact mode would help.
The amount of information displayed on the chart is quite large, so it naturally requires more space. To make navigation easier, we also added a feature that lets you click any cell to instantly open a new chart. That said, we’ll work on adding more customization options so you can adjust the panel’s content and size to your preference.
Installation was straightforward, but the documentation could use more screenshots for beginners.
Okay, we’ll update the description with more details. In the meantime, if you have any specific questions, feel free to ask and I’ll help you.
The comments section is now open. Feel free to share your feedback, reviews, questions, and personal experience with the product. You can also interact with other users and join the discussion. Our support team is active there as well and will respond whenever assistance is needed.