

Fundamental Analysis Signals
Fundamental Analysis Signals is a non-repaint MetaTrader indicator designed to detect and forecast large-scale market movements with precision. Powered by advanced algorithms, it delivers real-time signals across all asset classes and timeframes, making it an essential tool for traders seeking to align their strategies with macroeconomic momentum.
Category : Technical Indicators
Version : 3.1
Updated : 2026-04-05
Key Features
Description
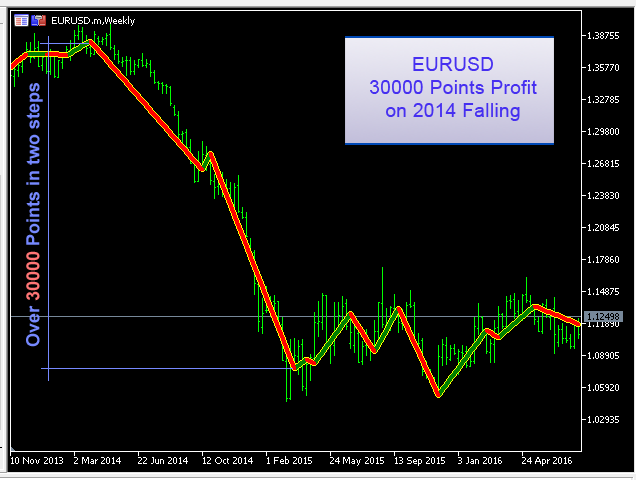
Fundamental Analysis Signals combines cutting-edge technology with a streamlined user experience to offer powerful predictive capabilities — capable of anticipating market moves exceeding 3,000 pips (30,000 points). Its intelligent calculation engine analyzes data patterns and price behavior to identify high-probability turning points, especially effective on higher timeframes where macro trends dominate. The indicator is fully non-repaint, ensuring that signals remain stable and trustworthy once generated. Designed for traders of all levels, it requires no complex input configurations or optimization routines — simply attach it to your chart and start receiving actionable insights. Whether you’re trading Forex pairs, metals, indices, stocks, or cryptocurrencies, Fundamental Analysis Signals adapts seamlessly to any symbol, helping you stay ahead of market shifts driven by economic forces.
See also:
Usage Manual:
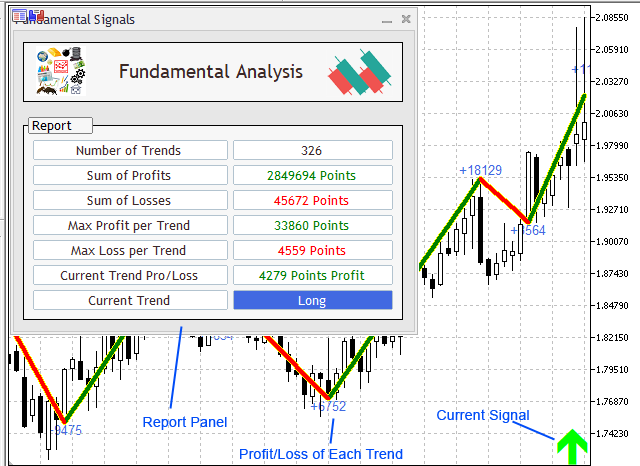
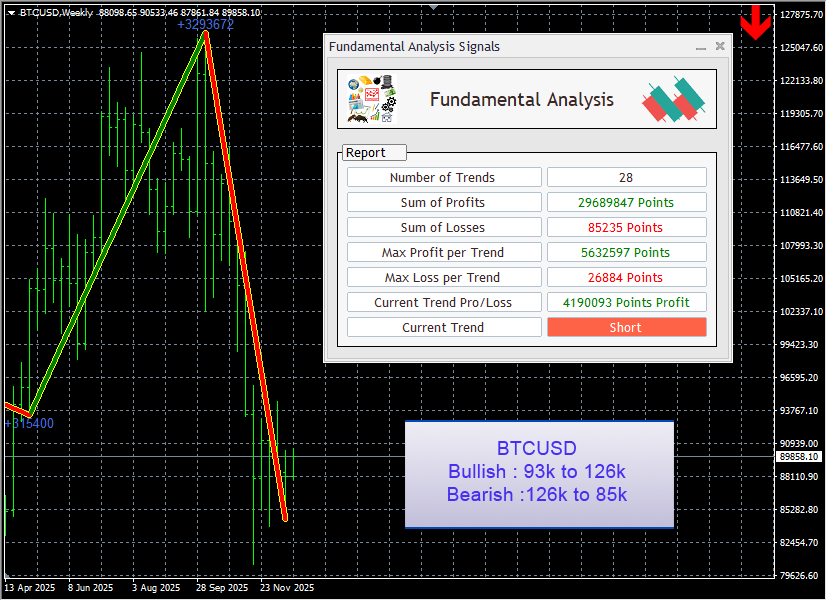
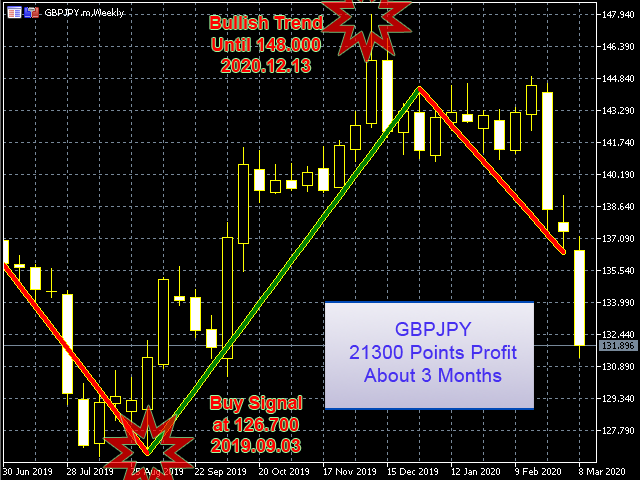
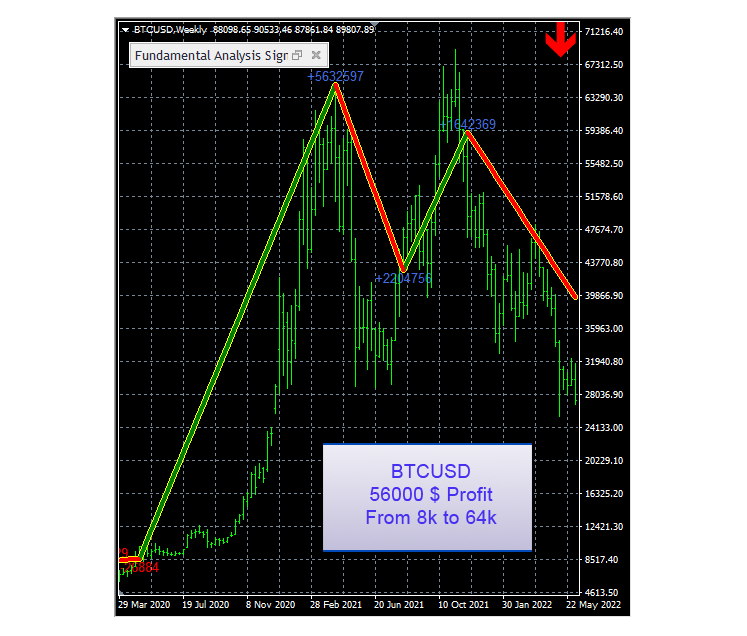
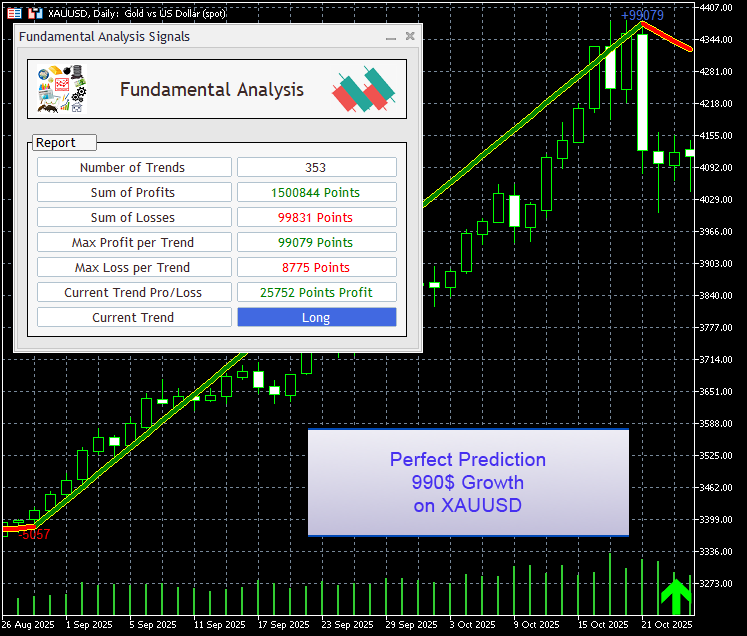
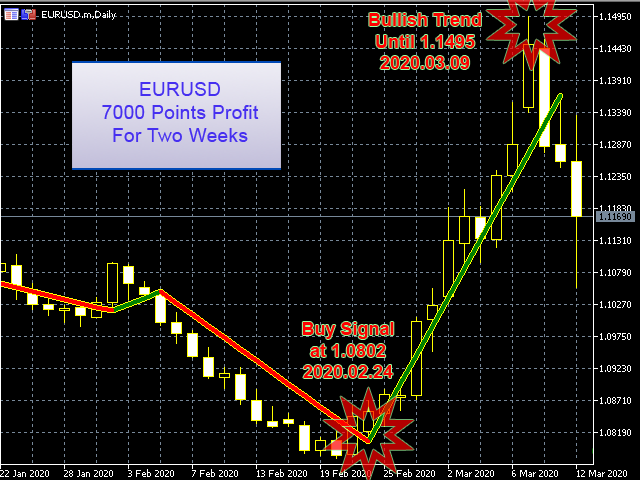
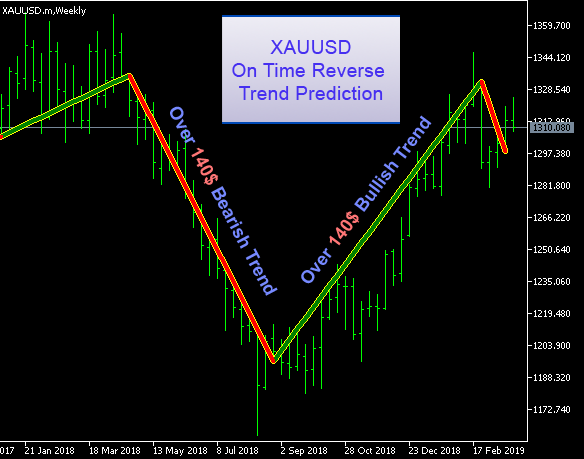
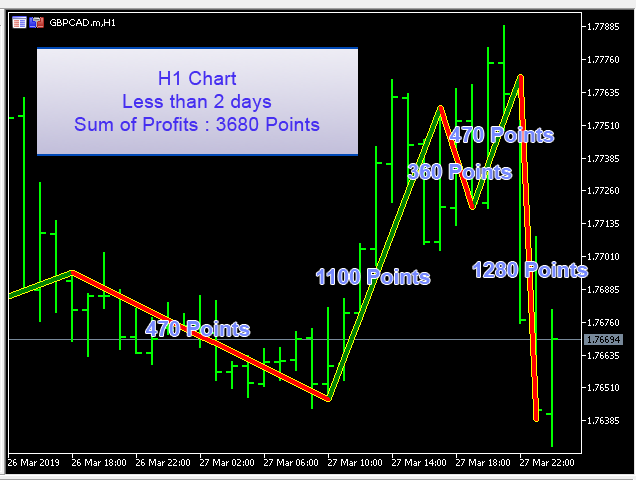
The Fundamental Analysis Signals Indicator is designed for simplicity, with no complicated input parameters required. Market trends are displayed directly on the chart using clear visual cues: green lines for bullish movements and red lines for bearish movements. To make interpretation effortless, the current trend direction is highlighted in the corner of the chart with arrows — green for upward trends and red for downward trends. In addition, a comprehensive information panel is available, providing a summary of past signal results along with the current signal direction. This panel can be easily enabled or disabled according to your preference, giving traders full control over how much detail they want to see.
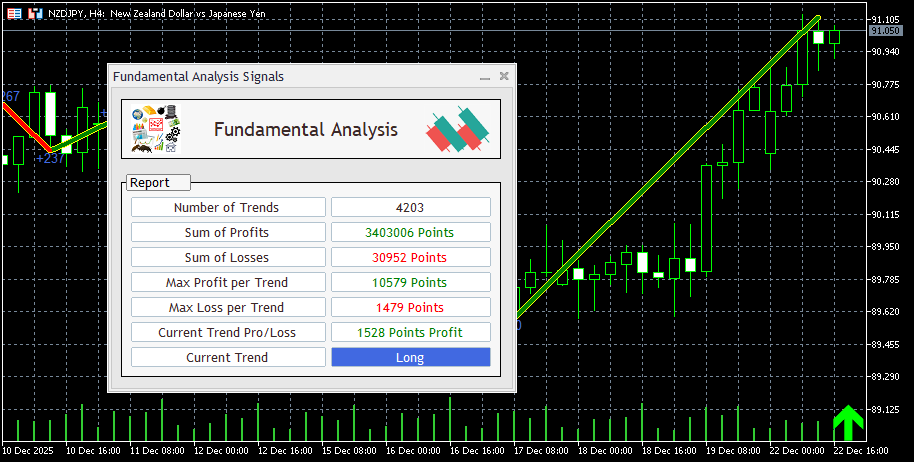
The Indicator is designed with simplicity in mind. This streamlined approach ensures traders can easily adjust the indicator to match their preferred trading style without dealing with complex configurations.
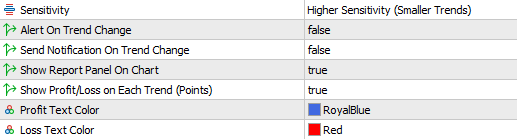
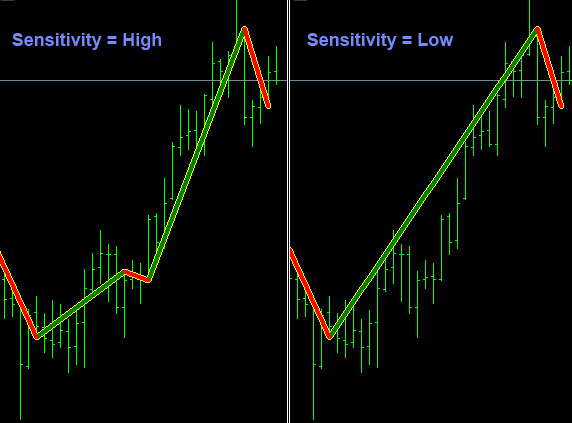
The primary parameter that influences signal behavior is “Sensitivity”, which controls how responsive the indicator is to local price changes.
- Low Sensitivity → Focuses on capturing larger, long‑term trends.
- Medium Sensitivity → Balances between major moves and moderate fluctuations.
- High Sensitivity → Reacts quickly to smaller market shifts, changing direction more frequently.
Notes:
Timeframe Selection:
The indicator is specifically designed to support long‑term trading strategies. Long‑term trading offers traders stability, compounding growth, and reduced stress compared to short‑term speculation. By focusing on extended time horizons, investors can ride out temporary volatility, benefit from compounding returns, and avoid the pitfalls of emotional, reactionary trading.
The indicator can be applied across all timeframes to suit your trading strategy; however, for optimal performance and more reliable signals, the recommended timeframes are H4 and D1.
The Indicator Core:
The indicator itself does not apply a fundamental analysis strategy. However, its advanced algorithms are capable of capturing market trends with a scale and reliability comparable to fundamental analysis. That is why we chose the name ‘Fundamental Analysis Signals’ — to reflect its ability to detect and follow major market movements with similar certainty.
Need Help?
Here are some helpful resources. If you have questions or need assistance, feel free to contact us. You can submit a support ticket or leave a comment. we’ll respond as quickly as possible.
Screenshots
Pricing
New Offer Every 6 Hours up to 50%. Follow.
Testing is free. How to do?

3 Months
3 Months of unlimited use
2 Accounts Activation
Full Support
Free Updates
$ 30.00

6 Months
6 Months of unlimited use
3 Accounts Activation
Full Support
Free Updates
$ 50.00

Lifetime
Unlimited use, forever
5 Accounts Activation
VIP Support
Free Updates
$ 90.00
 to be a light for all traders.
What does the Sensitivity parameter do?
Sensitivity controls how responsive the indicator is to local price changes.
• Low Sensitivity: Captures larger, long term trends.
• Medium Sensitivity: Balances between major moves and moderate fluctuations.
• High Sensitivity: Reacts quickly to smaller market shifts.
How does this indicator help long term traders?
By focusing on higher timeframes, it filters out short term noise and highlights major market trends. This allows long term traders to hold positions with confidence and avoid premature exits.
Works flawlessly on Bitcoin and Ethereum charts. I am testing others now.
Trading used to feel like guessing. Now it feels like planning.
What assets can I trade with this indicator?
The indicator works across Forex pairs, metals, indices, stocks, and cryptocurrencies. Its versatility makes it suitable for multi‑asset traders who want consistent signals across different markets.
It helps me stay in trades longer and avoid premature exits.
Simple setup, powerful results. Works exactly as promised.
No optimization headaches. I just installed and started trading.
Caught a 9,500 points move last week thanks to this tool.
I tested it on NASDAQ — caught a huge trend.
The indicator gave me confidence to place my first trades. Perfect.
Hi, What makes Fundamental Analysis Signals different from other indicators? What is the power of this indicator?
Hi. Unlike many repaint indicators, this tool provides stable, non‑repaint signals that remain valid for backtesting. It’s designed for simplicity, with only one major input parameter (Sensitivity) making it easy to use for both beginners and professionals.
How does the arrow system work?
Arrows appear in the corner of the chart to show the current trend direction. A green arrow signals bullish momentum, while a red arrow signals bearish momentum. This makes it easy to confirm the trend at a glance.
This tool makes long‑term trading much easier. On H4 and D1 charts, it consistently captures big moves, helping me stay in trades longer and avoid getting shaken out by short‑term noise.
I rated it 5 stars.
Best long‑term trend predictor I’ve used on MT4.
Is it suitable for crypto trading?
Yes. The indicator adapts well to crypto volatility, providing clear signals on assets like Bitcoin and Ethereum,… while filtering out unnecessary short term fluctuations.
I’ve tested dozens of indicators, this one stands out for accuracy and simplicity.
I’m new to trading, but this indicator made it easy to follow trends.
The comments section is now open. Feel free to share your feedback, reviews, questions, and personal experience with the product. You can also interact with other users and join the discussion. Our support team is active there as well and will respond whenever assistance is needed.