

3D Trends
The 3D Trends Indicator is a non‑repaint technical tool that uses multiple moving averages to create a 3D surface view of market trends. Instead of relying on a single fixed moving average period, this indicator generates a dynamic cloud area formed by a range of moving averages. This approach removes uncertainty, highlights overlapping trend zones, and provides traders with a clearer picture of market direction.
Category : Technical Indicators
Version : 1.7
Updated : 2025-12-22
Key Features
Description
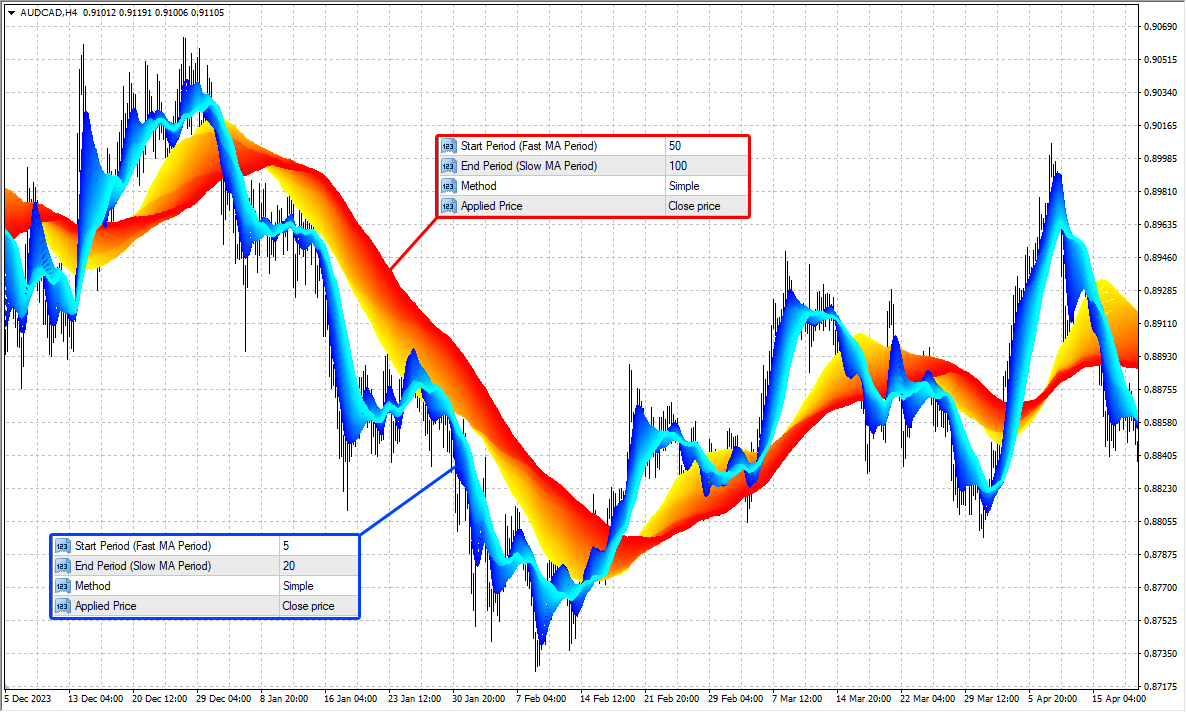
The 3D Trends Indicator offers traders a powerful way to reduce uncertainty in technical analysis by replacing single‑period moving averages with a dynamic cloud built from multiple periods. This non‑repaint design ensures signals remain reliable after candle close, giving traders confidence in their decisions. By visualizing a range of moving averages in a 3D surface view, the indicator highlights overlapping zones of support and resistance, reveals hidden momentum, and provides a clearer picture of market structure. The customizable visuals — from gradient colors to line styles and widths — allow traders to tailor the cloud display to their preferences, making complex data easy to interpret at a glance.
In practice, the indicator is highly versatile. Day traders can use short‑term clouds to track intraday momentum, while swing traders benefit from mid‑ and long‑term clouds that reveal broader market trends. Alerts and notifications keep traders informed when candles interact with the cloud, ensuring timely responses to breakouts or reversals. Whether applied to Forex, stocks, indices, or crypto, the 3D Trends Indicator provides a structured, multi‑period perspective that enhances decision‑making and risk management.
Usage Manual:
Main Settings:
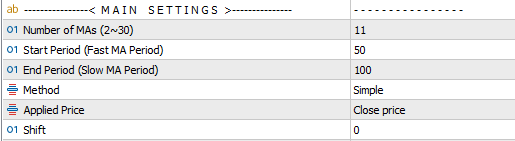
- Number of MAs (2–30): Select how many moving averages to plot.
- Start Period (Fast MA): Define the smallest MA period.
- End Period (Slow MA): Define the largest MA period.
- Method: Choose SMA, EMA, SMMA, or LWMA.
- Applied Price: Select Close, Open, High, Low, Median, Typical, or Average.
- Shift: Apply a shift value to move the MA lines.
Visual Settings:
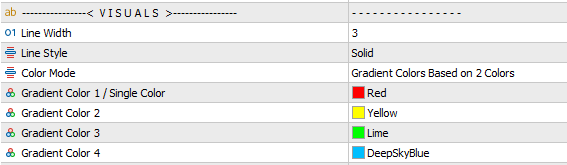
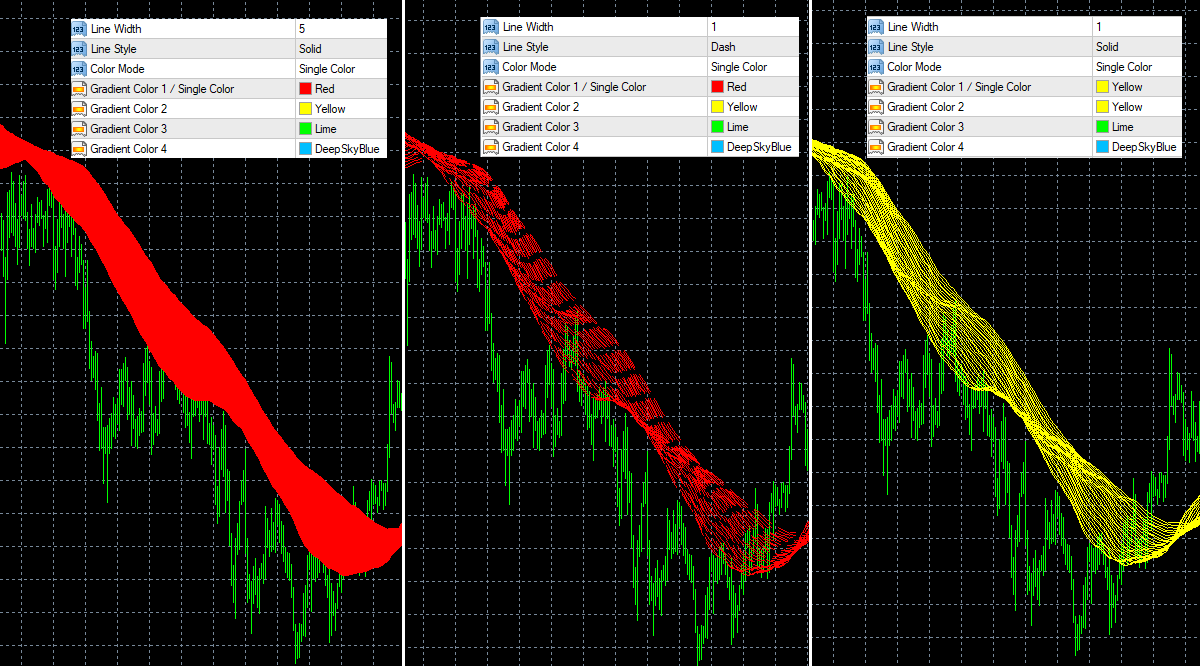
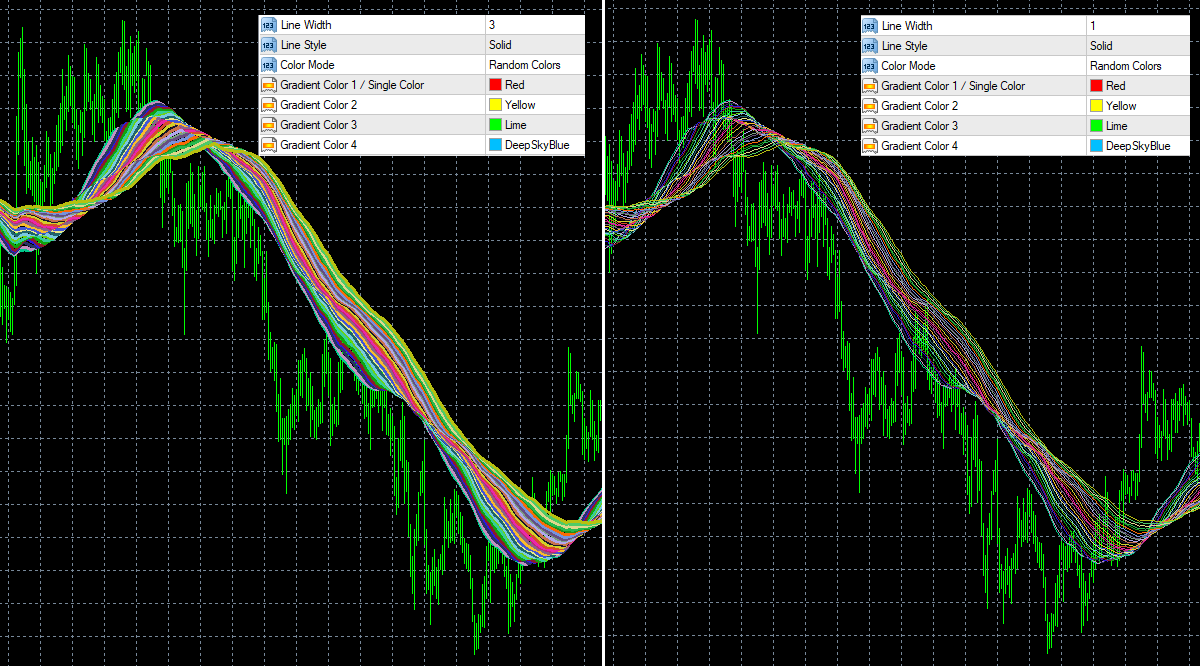
- Line Width: Adjust thickness (large values = filled cloud, small values = separate lines).
- Line Style: Choose Solid, Dash, Dot, DashDot, or DashDotDot.
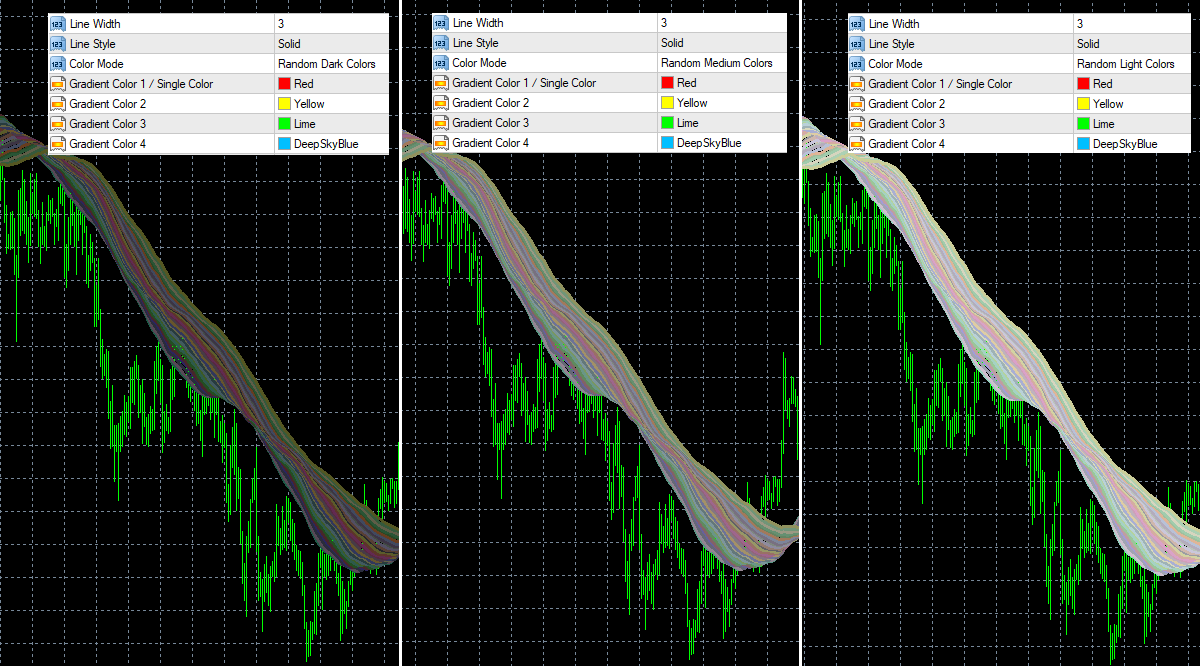
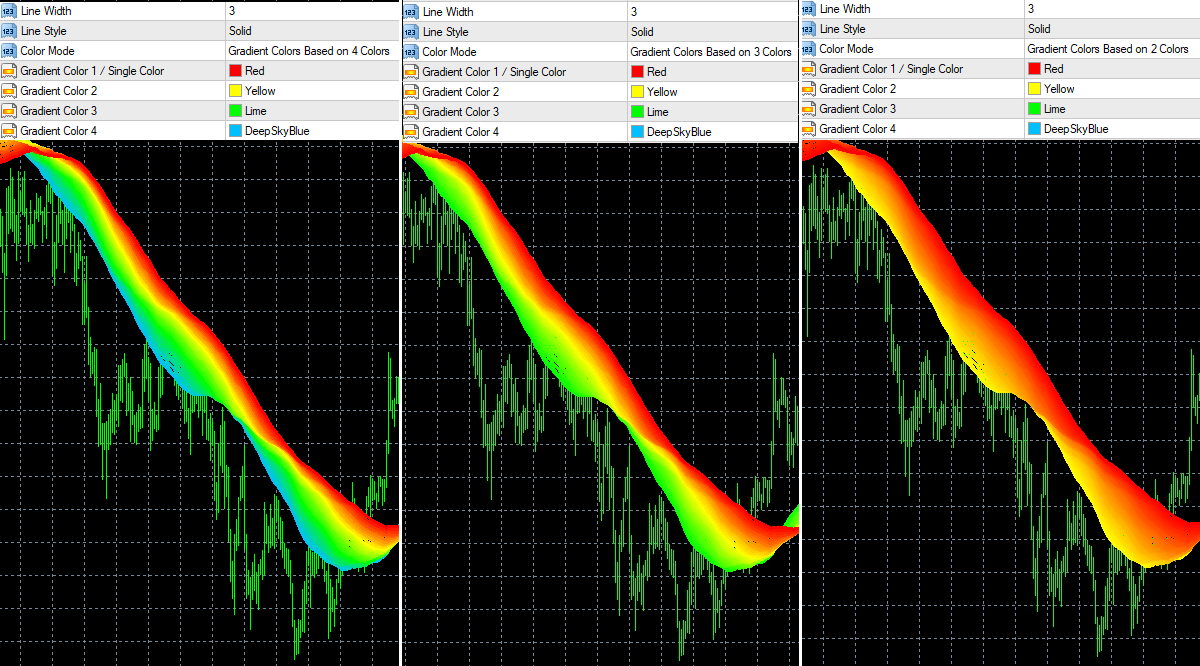
- Color Mode: Select gradient or single color display.
- Gradient Colors: Up to four gradient colors for cloud visualization.
Alert Settings:
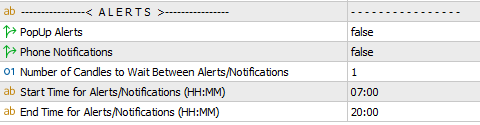
- PopUp Alerts: Enable/disable desktop alerts.
- Phone Notifications: Enable/disable mobile alerts.
- Candle Delay: Set number of candles to wait between alerts.
- Alert Window: Define start and end times for notifications.
Tips:
- Example: If Number of MA = 5, Start Period = 10, and End Period = 30, the indicator will draw 5 MA lines with periods 10, 15, 20, 25, and 30.
- Attach multiple instances to create short‑term, mid‑term, and long‑term clouds for layered analysis or if you want layered analysis across different time horizons.
Need Help?
Here are some helpful resources. If you have questions or need assistance, feel free to contact us. You can submit a support ticket or leave a comment. we’ll respond as quickly as possible.
Screenshots
Pricing
New Offer Every 6 Hours up to 50%. Follow.
Testing is free. How to do?

1 Year
1 Year of unlimited use
4 Accounts Activation
Full Support
Free Updates
$ 30.00

Lifetime
Unlimited use, forever
5 Accounts Activation
VIP Support
Free Updates
$ 40.00
 to be a light for all traders.
Why use multiple moving averages instead of one?
A single MA can be misleading. By plotting a range, 3D Trends shows the broader structure and reduces false signals.
The cloud makes my charts look amazing.
Trading trends has never been this clear.
It took me a few days to understand cloud thickness, but once I did, it became very useful.
The non‑repaint design gives me confidence. Once a candle closes, the signal stays reliable.
I recommend 3D Trends to my students. It simplifies technical analysis and teaches them to respect market structure.
Beautiful view. It is easy for trading using this indicator.
Clouds highlight overlapping zones where price reacts. That’s invaluable for risk management.
The comments section is now open. Feel free to share your feedback, reviews, questions, and personal experience with the product. You can also interact with other users and join the discussion. Our support team is active there as well and will respond whenever assistance is needed.