
VWAP
VWAP (Volume Weighted Average Price) is a widely used trading indicator that calculates the average price of an asset, weighted by trading volume, over a specific period. Unlike simple moving averages, VWAP integrates both price and volume, offering a more accurate benchmark of fair value. It is a standard tool for institutional traders, retail investors, and algorithmic systems.
The VWAP indicator is an essential tool for traders seeking accuracy, clarity, and institutional‑grade analysis. By combining price and volume, VWAP provides a fair value benchmark, dynamic support/resistance, and actionable trading signals. Whether you’re a beginner or an experienced trader, VWAP enhances your strategy with professional insights.
Category : Technical Indicators
Version : 3.0
Updated : 2026-03-01
Key Features
Description
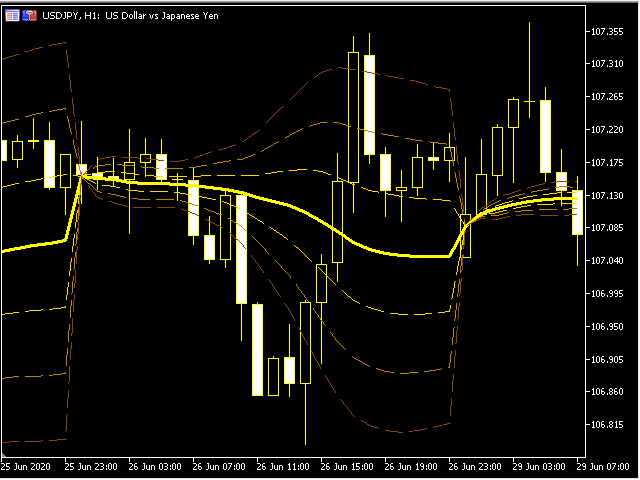
The VWAP indicator is designed with flexibility and precision in mind. Traders can apply it across multiple periods — daily, weekly, monthly, or even custom sessions — to suit any strategy. It supports a wide range of price inputs including OHLC, Median, Typical, Weighted prices, and Moving Averages, ensuring accurate calculations tailored to your trading style. With up to three deviation lines available, VWAP provides deeper insight into volatility and price behavior, while both real volumes and tick volumes are fully supported for reliable analysis.
Beyond its analytical power, VWAP offers extensive graphical customization so you can adjust visuals to match your chart preferences. Real‑time alerts notify you instantly of breakouts or crossovers, helping you act quickly on market opportunities. Despite its advanced capabilities, the indicator remains lightweight and fast, delivering seamless updates without slowing down your platform. For developers, dedicated buffers make it easy to integrate VWAP data into automated systems or custom dashboards, making it a versatile solution for both manual and algorithmic trading.
Input Parameters:
The EA input list is organized into four main sections:
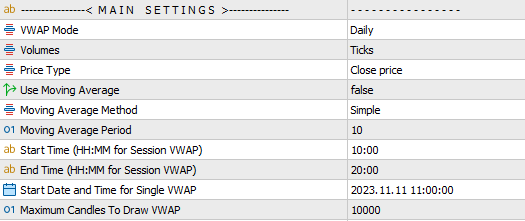
Main Settings:
This area allows full customization of VWAP modes, price types, volume sources, session definitions, and the time range for VWAP histograms.
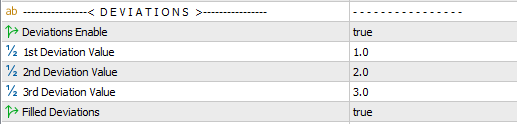
Deviations:
Here you can configure deviation lines and zones to refine your analysis.
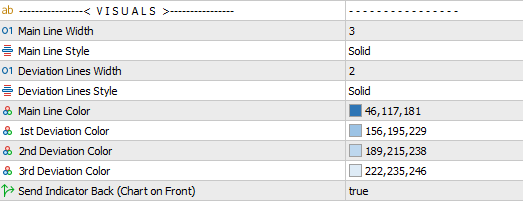
Visuals:
All graphical elements of the VWAP histogram can be tailored, including colors, line thickness, and styles, giving you complete control over chart appearance.
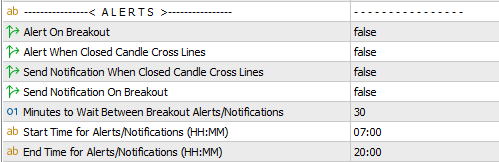
Alerts:
This section manages the alerting system, enabling you to set up notifications for breakouts or crossovers.
Note:
If you need to display multiple sessions within a single day, or prefer to have two or more VWAP histograms overlapping, simply attach additional instances of the indicator to your chart, each configured with different settings.
About VWAP:
VWAP was introduced in the 1980s by Kyle Krehbiel, primarily as a tool for institutional traders to measure execution quality. Large funds and banks needed a way to assess whether their trades were executed at favorable prices without distorting the market. VWAP became the standard because it accounts for both price and volume, offering a fair representation of the day’s trading activity
Over time, VWAP gained popularity among retail traders as well. Its ability to act as dynamic support and resistance made it useful for intraday strategies, while its role as a benchmark ensured consistency across different trading styles. Today, VWAP is widely available on most trading platforms and has evolved into variations like Anchored VWAP and Rolling VWAP.
The Volume Weighted Average Price (VWAP) is a technical analysis tool that combines both price and volume to provide a more accurate measure of a security’s average trading price during a session. Unlike simple moving averages, which only consider price, VWAP integrates trading volume, making it a more reliable reflection of market activity. It is typically plotted as a single line on intraday charts and is used to identify whether an asset is trading at a premium or discount relative to its average.
Practical Usage:
- Trend Identification: Price above VWAP suggests bullish sentiment; below VWAP indicates bearish sentiment.
- Support & Resistance: VWAP often acts as a magnet for price, serving as intraday support or resistance.
- Execution Benchmark: Institutions aim to buy below VWAP or sell above VWAP to ensure efficient execution.
- Mean Reversion: Deviations from VWAP often revert back, creating trading opportunities.
Benefits of VWAP:
- Accuracy: Combines price and volume for realistic averages.
- Versatility: Useful for scalpers, day traders, and swing traders.
- Clarity: Simplifies decision‑making by showing premium vs. discount zones.
- Risk Management: Identifies optimal entry and exit points.
- Professional Insight: Replicates institutional benchmarks for execution.
Need Help?
Here are some helpful resources. If you have questions or need assistance, feel free to contact us. You can submit a support ticket or leave a comment. we’ll respond as quickly as possible.
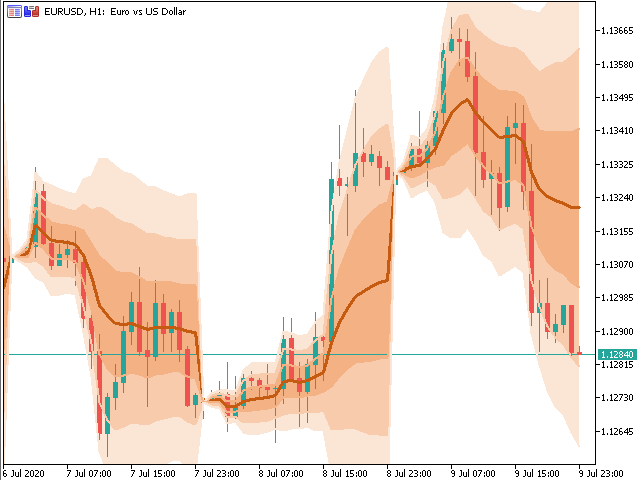
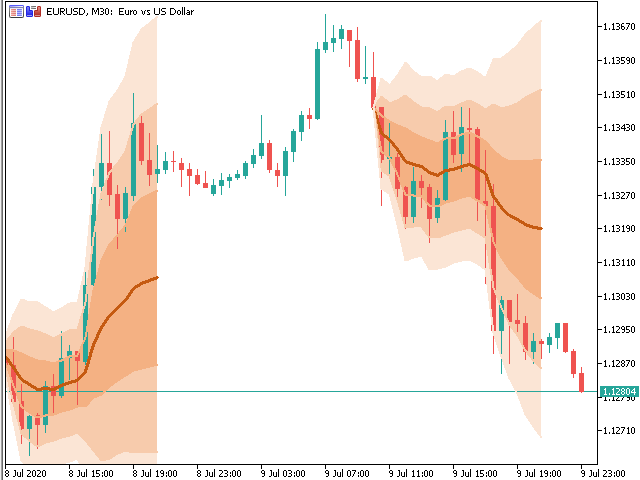
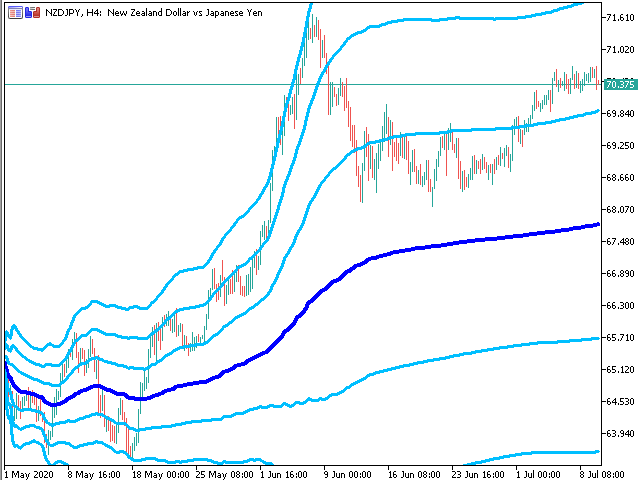
Screenshots
Pricing
New Offer Every 6 Hours up to 50%. Follow.
Testing is free. How to do?

6 Months
6 Months of unlimited use
3 Accounts Activation
Full Support
Free Updates
$ 30.00
$ 24.00

1 Year
1 Year of unlimited use
4 Accounts Activation
Full Support
Free Updates
$ 40.00
$ 32.00

Lifetime
Unlimited use, forever
5 Accounts Activation
VIP Support
Free Updates
$ 50.00
$ 40.00
 to be a light for all traders.
VWAP passed every backtest I ran.
How does VWAP help with breakout confirmation?
Breakouts beyond VWAP with strong volume are more reliable. VWAP ensures the move isn’t just thin trading but supported by participation.
It’s simple but powerful.
VWAP isn’t a magic bullet, but it’s a reliable benchmark.
The indicator is lightweight but delivers institutional‑grade insights.
Does the indicator include buffers?
Yes, of course. Open “Data Window” to see its buffers and values.
VWAP supports both real and tick volumes. It adapts to different instruments seamlessly.
VWAP deviation lines show me volatility zones I never noticed before.
I use VWAP every morning to gauge intraday sentiment. It’s my first check before trading.
I wish VWAP had more default templates, but customization makes up for it.
Does VWAP work well in thinly traded markets?
VWAP is most effective in liquid markets, but it can still be applied to thin instruments. In such cases, adjusting precision settings and focusing on anchored VWAP improves clarity.
VWAP seems intraday‑focused. Does it have value for long‑term investors?
Yes. Long‑term investors use VWAP to identify institutional footprints. By applying VWAP to weekly or monthly charts, they can see whether price is trading above or below fair value over extended periods. This helps in timing entries for large positions or evaluating whether a stock is overbought or undervalued.
I didn’t believe in VWAP until I tried it.
How does VWAP help me decide whether to enter a trade during consolidation?
VWAP highlights balance zones where most trading occurs. During consolidation, price often oscillates around VWAP. If price holds above VWAP, it suggests buyers are in control; below VWAP indicates sellers dominate. This helps traders avoid false entries and wait for genuine breakouts.
I find a tip: VWAP deviation lines highlight volatility zones. I use them to set stop losses and profit targets with confidence.
Why is VWAP better than a simple moving average?
VWAP accounts for trading volume, making it more accurate than averages based only on price.
Can VWAP help avoid false breakouts?
VWAP highlights balance zones, making it easier to spot genuine breakouts.
Thanks a lot. Now VWAP is my daily reference for fair value.
The comments section is now open. Feel free to share your feedback, reviews, questions, and personal experience with the product. You can also interact with other users and join the discussion. Our support team is active there as well and will respond whenever assistance is needed.