

TPO Profile
TPO Profile is a professional Market Profile indicator for MetaTrader 4 and MetaTrader 5 that organizes price action into Time Price Opportunities (TPOs). Instead of focusing on volume, TPO Profile highlights how much time the market spends at each price level, giving traders a unique perspective on market balance and acceptance.
Category : Technical Indicators
Version : 2.11
Updated : 2026-02-21
Key Features
Description
TPO (Time Price Opportunity) focuses on how long the market spends at each price level, while candlestick charts focus on how price moves within a time interval. TPO reveals market balance and acceptance zones, whereas candlesticks show volatility and directional moves.
Candlestick charts are excellent for visualizing price action and volatility, but TPO adds a deeper layer of context by showing where the market spends time. Together, they provide a fuller picture of market structure and trader behavior.
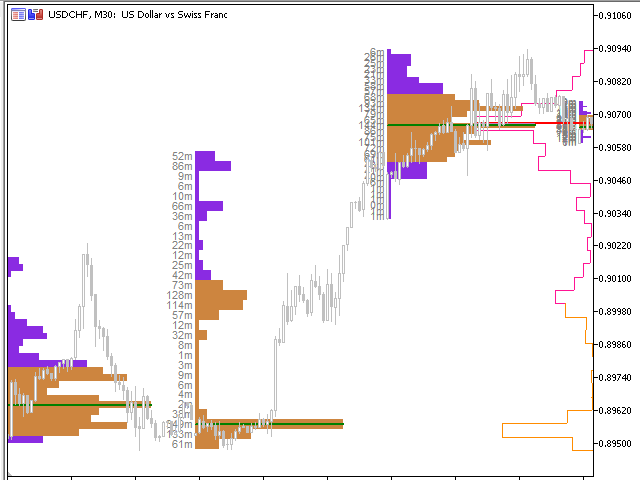
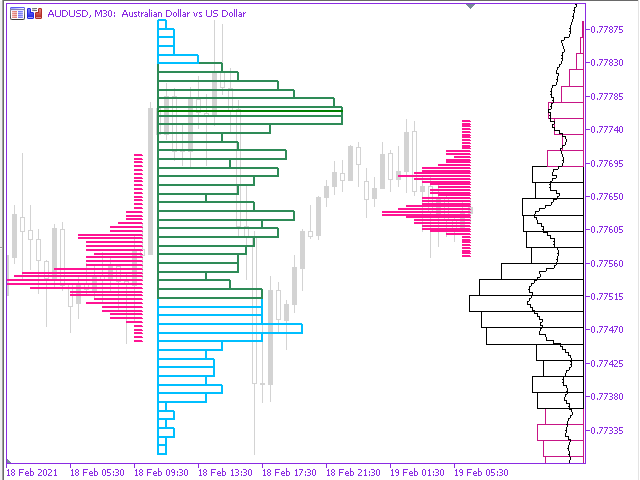
The indicator is divided into two main sections. The first section is the on‑chart profiles, which are directly linked to the candles and drawn within the chart area. These can be adjusted according to different timeframes such as sessions, daily, weekly, or monthly periods. The second section is the on‑side profiles, which are anchored to either the right or left side of the chart and are calculated based on a specified number of days.
See similar products also:
Adjustment of parameters:
On-Chart Profiles:
In the “On‑Chart” section, you can configure a range of input parameters to customize how profiles are displayed :
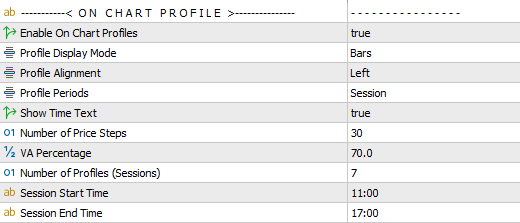
- Enable on chart profiles
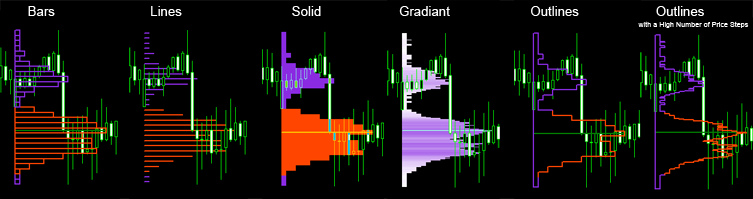
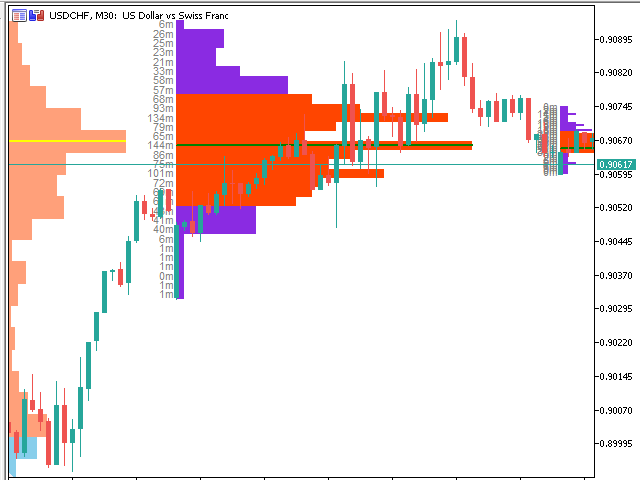
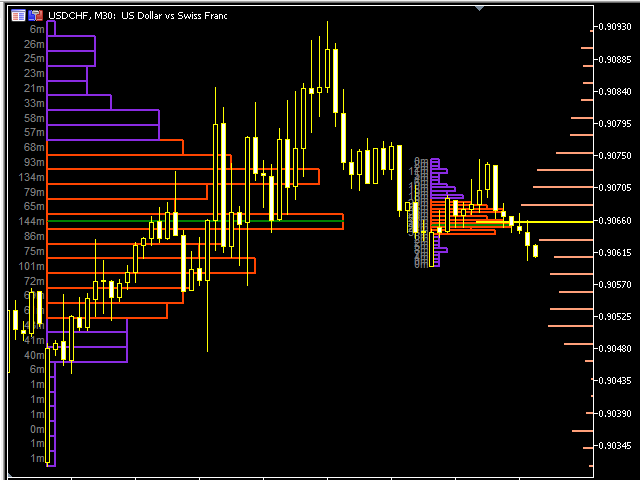
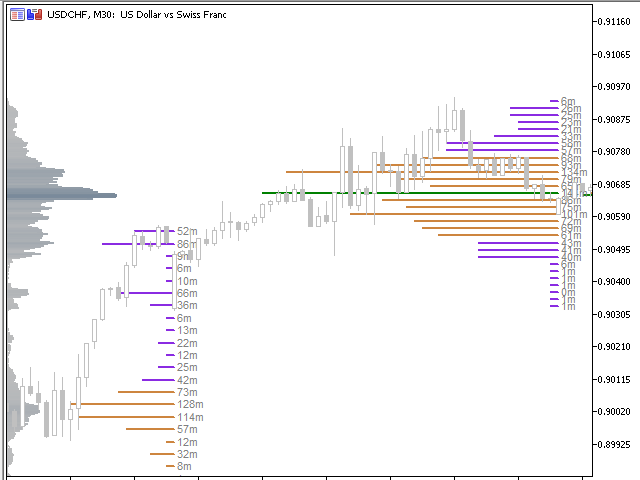
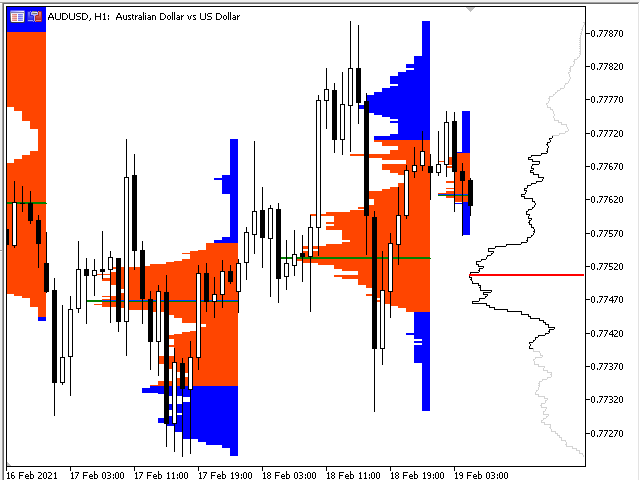
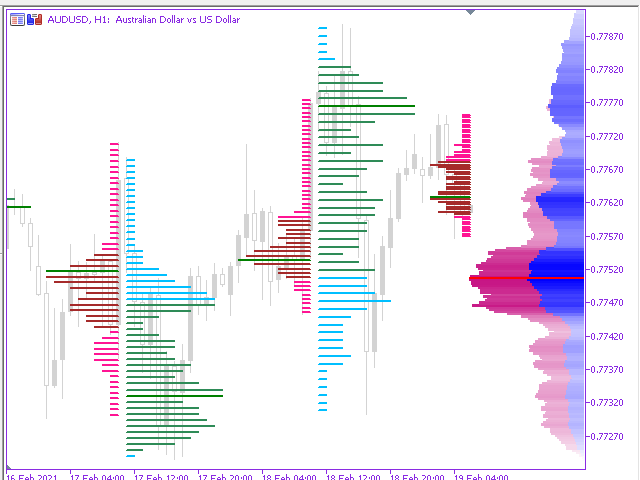
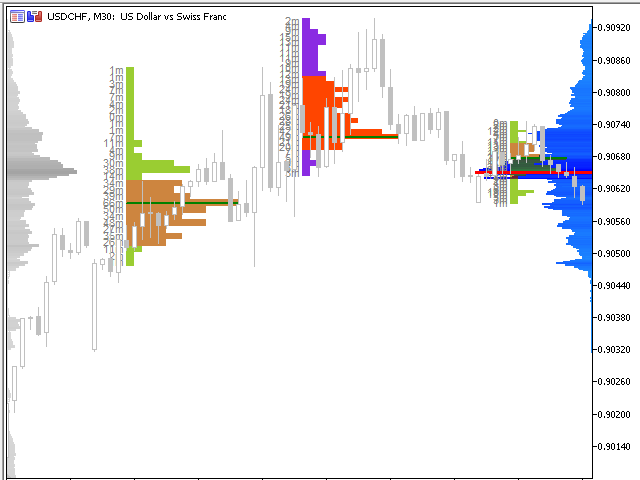
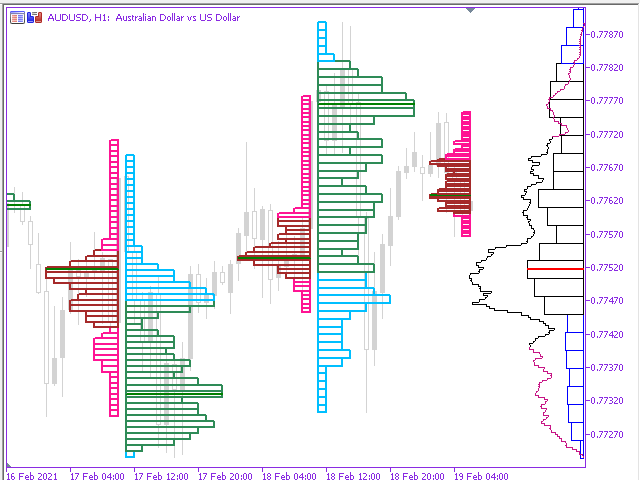
- Profile Display Mode: Lines/Solid/Gradient/Bars/Outline (as shown on the below)
- Profile Alignment: Right/Left
- Profile Periods: Session/Daily/Weekly/Monthly
- Show Volume Text
- Number of Price Steps: Number of horizontal divisions of profile
- VA Percentage: Percentage of Value Area
- Number of Profiles (Sessions)
- Session Start Time
- Session End Time
Side Profiles:
The “On‑Side” section includes several input parameters:
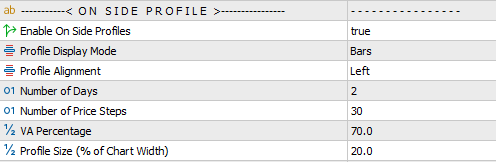
- Enable on side profiles
- Volumes: Tick or Real Volumes — If you choose to use real volumes, ensure that real volume data is available for the selected symbol.
- Profile Display Mode: Lines/Solid/Gradient/Bars/Outline (as shown on the above)
- Profile Alignment: Right/Left
- Number of Days: Number of days included in profile calculation
- Number of Price Steps: Number of horizontal divisions of profile
- VA Percentage: Percentage of Value Area
- Profile Size (% of Chart Width)
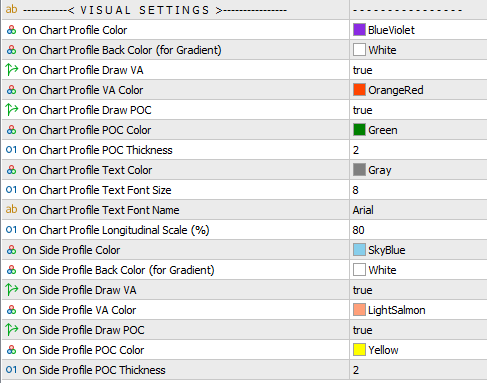
Visual Settings:
A comprehensive set of visual settings is available, allowing you to adjust profile colors, size, thickness, and more.
Note:
If you want to display multiple sessions in a single day, show histograms on both the left and right sides of the chart, or overlay two or more histograms at once, simply attach additional instances of the indicator to the chart with different settings.
About TPO Profile:
General Usage of TPO Profile:
Market Balance Analysis
TPO Profile shows where the market spends the most time, highlighting areas of price acceptance.
Support & Resistance Mapping
Price levels with extended TPO activity often act as strong support or resistance zones.
Value Area & POC Confirmation
Use VA and POC levels to confirm trade setups and improve entry/exit precision.
Session & Multi‑Day Analysis
Break down market behavior by session, daily, weekly, or monthly profiles to align short‑term and long‑term strategies.
Institutional Methodology
TPO analysis is widely used by professional traders. This indicator brings institutional‑grade Market Profile concepts into MT4/MT5.
Benefits of Using TPO Profile:
Clarity in Market Structure
See where the market is balanced versus where it rejects price levels.
Improved Trade Planning
Align trades with VA and POC levels for more precise entries and exits.
Risk Management
Set logical stop‑loss and take‑profit levels based on TPO distributions.
Example Scenarios:
Intraday Trading: A trader sees price consolidating around the session’s POC and prepares for a breakout.
Swing Trading: Weekly TPO shows a value area forming at resistance. The trader waits for rejection before shorting.
Risk Control: Stops are placed outside the Value Area, reducing the chance of being caught in noise.
Buffers for Developers:
Developers can integrate the available buffers into custom dashboards, indicators, or Expert Advisors. The following table lists the buffer numbers along with their corresponding contents.
| Buffer Index | Shift Value | Description |
|---|---|---|
| 0 | 0 ~ N-1 | Prices of Latest On-Chart Profile |
| 1 | 0 ~ N-1 | Equivalent Volumes of Latest On-Chart Profile |
| 2 | 0 ~ N-1 | Prices of Latest On-Side Profile |
| 3 | 0 ~ N-1 | Equivalent Times of Latest On-Side Profile |
| 4 | 0 | POC of Latest On-Chart Profile |
| 5 | 0 | VAL of Latest On-Chart Profile |
| 6 | 0 | VAH of Latest On-Chart Profile |
| 7 | 0 | POC of Latest On-Side Profile |
| 8 | 0 | VAL of Latest On-Side Profile |
| 9 | 0 | VAH of Latest On-Side Profile |
Notes :
N represents the number of price steps, which defines the accuracy of the profile.
Only the buffers from the most recent profile are available.
Examples and Code Snippets:
for( i=0; i<N; i++)
{
    TPO_onChart_Price[i]=iCustom(Symbol(),Period(),"TPO Profile MT4",.....inputs......,0,i);
    TPO_onChart_Times[i]=iCustom(Symbol(),Period(),"TPO Profile MT4",.....inputs......,1,i);
    TPO_onSide_Price[i]=iCustom(Symbol(),Period(),"TPO Profile MT4",.....inputs......,2,i);
    TPO_onSide_Times[i]=iCustom(Symbol(),Period(),"TPO Profile MT4",.....inputs......,3,i);
}
TPO_onChart_POC=iCustom(Symbol(),Period(),"TPO Profile MT4",.....inputs......,4,0);
TPO_onChart_VAL=iCustom(Symbol(),Period(),"TPO Profile MT4",.....inputs......,5,0);
TPO_onChart_VAH=iCustom(Symbol(),Period(),"TPO Profile MT4",.....inputs......,6,0);
TPO_onSide_POC=iCustom(Symbol(),Period(),"TPO Profile MT4",.....inputs......,7,0);
TPO_onSide_VAL=iCustom(Symbol(),Period(),"TPO Profile MT4",.....inputs......,8,0);
TPO_onSide_VAH=iCustom(Symbol(),Period(),"TPO Profile MT4",.....inputs......,9,0); int handleTPO=iCustom(Symbol(),Period(),"TPO Profile MT5",.....inputs......);
if( handleTPO==INVALID_HANDLE ) Print("Invalid Handle for Indicator. Err : ",GetLastError());
int nbuf;
nbuf=CopyBuffer(handleTPO,0,0,N,TPO_onChart_Price);
if( nbuf!=N ) Print("Copy Buffer Err : ",GetLastError());
nbuf=CopyBuffer(handleTPO,1,0,N,TPO_onChart_Times);
if( nbuf!=N ) Print("Copy Buffer Err : ",GetLastError());
nbuf=CopyBuffer(handleTPO,2,0,N,TPO_onSide_Price);
if( nbuf!=N ) Print("Copy Buffer Err : ",GetLastError());
nbuf=CopyBuffer(handleTPO,3,0,N,TPO_onSide_Times);
if( nbuf!=N ) Print("Copy Buffer Err : ",GetLastError());
nbuf=CopyBuffer(handleTPO,4,0,1,TPO_onChart_POC);
if( nbuf!=1 ) Print("Copy Buffer Err : ",GetLastError());
nbuf=CopyBuffer(handleTPO,5,0,1,TPO_onChart_VAL);
if( nbuf!=1 ) Print("Copy Buffer Err : ",GetLastError());
nbuf=CopyBuffer(handleTPO,6,0,1,TPO_onChart_VAH);
if( nbuf!=1 ) Print("Copy Buffer Err : ",GetLastError());
nbuf=CopyBuffer(handleTPO,7,0,1,TPO_onSide_POC);
if( nbuf!=1 ) Print("Copy Buffer Err : ",GetLastError());
nbuf=CopyBuffer(handleTPO,8,0,1,TPO_onSide_VAL);
if( nbuf!=1 ) Print("Copy Buffer Err : ",GetLastError());
nbuf=CopyBuffer(handleTPO,9,0,1,TPO_onSide_VAH);
if( nbuf!=1 ) Print("Copy Buffer Err : ",GetLastError()); Need Help?
Here are some helpful resources. If you have questions or need assistance, feel free to contact us. You can submit a support ticket or leave a comment. we’ll respond as quickly as possible.
Screenshots
Pricing
New Offer Every 6 Hours up to 50%. Follow.
Testing is free. How to do?

6 Months
6 Months of unlimited use
3 Accounts Activation
Full Support
Free Updates
$ 30.00

1 Year
1 Year of unlimited use
4 Accounts Activation
Full Support
Free Updates
$ 45.00

Lifetime
Unlimited use, forever
5 Accounts Activation
VIP Support
Free Updates
$ 60.00
 to be a light for all traders.
Is there a way to export the data?
Yes. Developers can access TPO data through buffers, making it easy to integrate with dashboards or automated systems.
TPO Profile isn’t suitable for traders who want instant signals. It requires patience and study. But once you understand how Value Areas and POC work, it becomes one of the most reliable tools for market structure.
Does TPO Profile highlight breakout zones?
Yes. By marking the Initial Balance and single prints, the indicator helps you spot potential breakout areas where price moves away from balance.
An indicator that completely is different from all other indicators. I like this. Pretty developed.
Does TPO Profile automatically adjust for different trading sessions (e.g., London, New York)?
Yes. You can configure session times to match your preferred market hours, making it easy to analyze specific regions.
If you’re looking for simple buy/sell signals, this isn’t it. TPO Profile is for serious traders.
Does this indicator show both left and right side histograms?
Yes, but you need to attach two instances of the indicator to chart. Adjust one to display right profile and the other one to display on left.
Can I run TPO Profile alongside VPO Profile for combined analysis?
Yes. Many traders use both together: TPO Profile shows time‑based acceptance, while VPO Profile shows volume‑based liquidity. Together, they provide a complete Market Profile view.
Thanks a lot.
TPO Profile is not for everyone. If you just want simple signals, this isn’t it. But if you’re serious about market structure, it’s worth the learning curve. Once you get it, you’ll never look at candlesticks the same way again.
Yes, I agree with you.
The tool is powerful and easy, but it takes effort to learn Market Profile concepts. Most of traders are not familiar with market profile such as TPO,VPO.
Hi,
A question:
What is the main difference between TPO Profile and regular candlestick charts?
Candlestick charts show price movement within time intervals (open, high, low, close), while TPO Profile shows how much time the market spends at each price level. This reveals balance zones, acceptance areas, and rejection points that candlesticks alone cannot display.
Can I see both daily and weekly profiles at the same time?
Yes. You can attach multiple instances of the indicator to the same chart, each configured for a different timeframe.
I have a better description in a word :
TPO is the full picture of Time and Price.
At first, the overlapping profiles confused me. Once I separated sessions, the clarity improved. A tutorial would help beginners.
We’ll work on adding more detailed explanations. In the meantime, if you need any assistance, we’re always here and ready to help you.
TPO Profile helps to avoid chasing price. I wait for time based acceptance before acting, and my discipline has improved.
Trading feels calmer when I know where the market is balanced.
The comments section is now open. Feel free to share your feedback, reviews, questions, and personal experience with the product. You can also interact with other users and join the discussion. Our support team is active there as well and will respond whenever assistance is needed.