

VPO Profile
VPO Profile is a professional-grade Market Profile indicator designed for MetaTrader 4 and MetaTrader 5. It visualizes trading activity by plotting horizontal volume histograms directly on the chart, helping traders identify key price levels where the most volume has been exchanged — known as Volume Price Opportunities (VPOs).
Category : Technical Indicators
Version : 2.11
Updated : 2026-02-25
Key Features
Description
Unlike traditional candlestick charts that display Open, High, Low, and Close, VPO Profile focuses on volume distribution across price levels, giving you a clearer picture of market behavior. This makes it an essential tool for identifying support and resistance zones, high-volume clusters, and price acceptance areas.
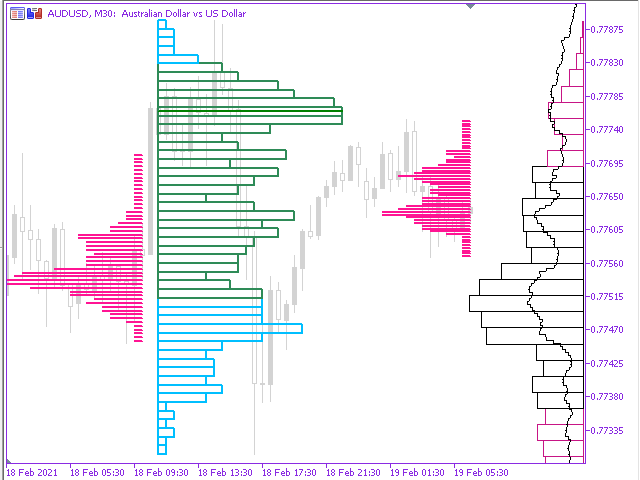
The indicator is divided into two main sections. The first section is the on‑chart profiles, which are directly linked to the candles and drawn within the chart area. These can be adjusted according to different timeframes such as sessions, daily, weekly, or monthly periods. The second section is the on‑side profiles, which are anchored to either the right or left side of the chart and are calculated based on a specified number of days.
See similar products also:
Adjustment of parameters:
On-Chart Profiles:
In the “On‑Chart” section, you can configure a range of input parameters to customize how profiles are displayed :
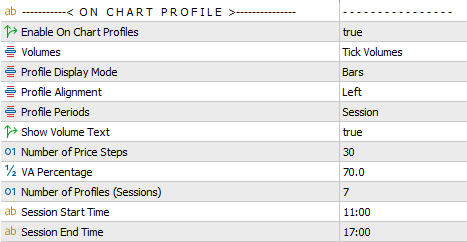
- Enable on chart profiles
- Volumes: Tick or Real Volumes — If you choose to use real volumes, ensure that real volume data is available for the selected symbol.
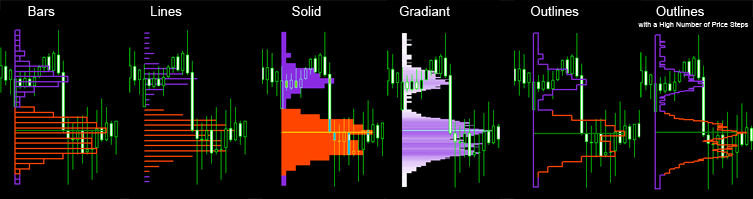
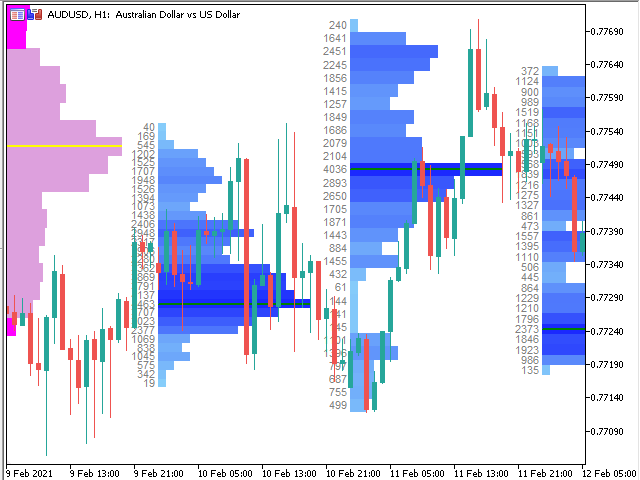
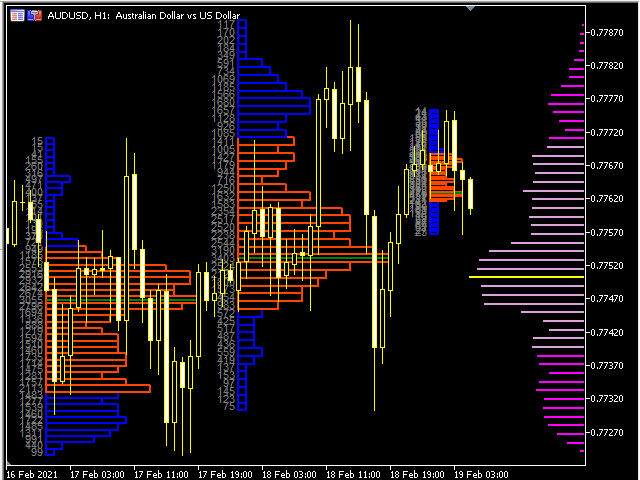
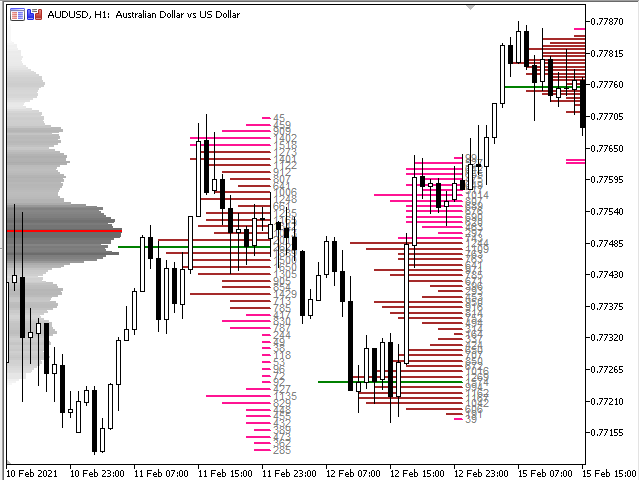
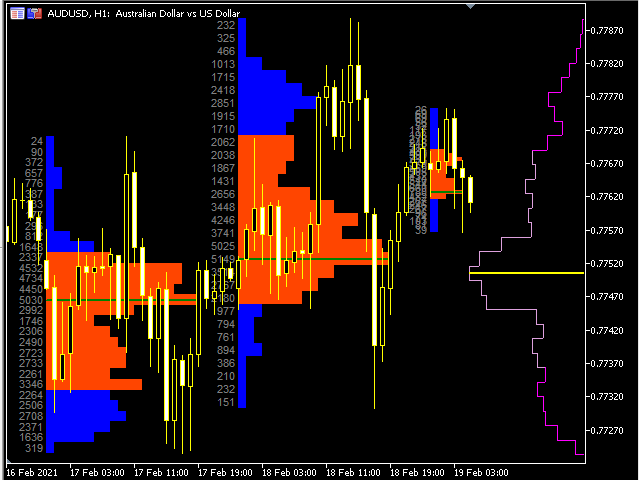
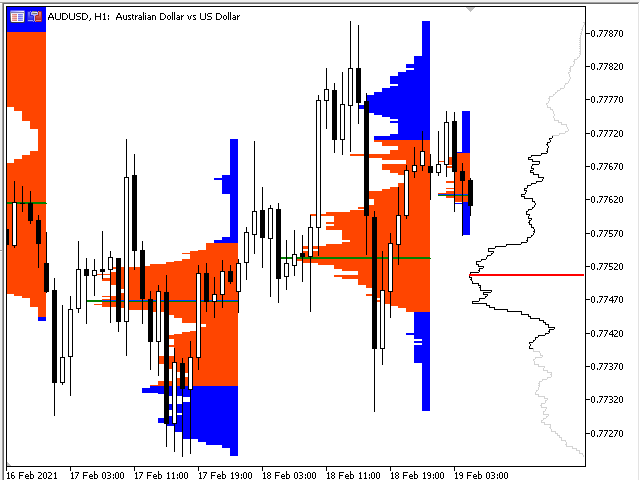
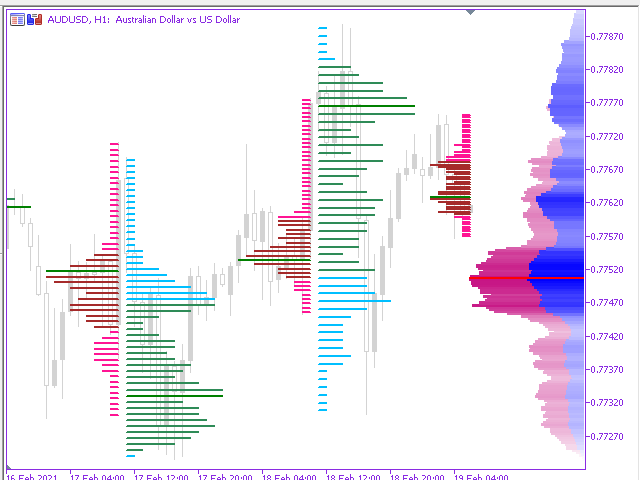
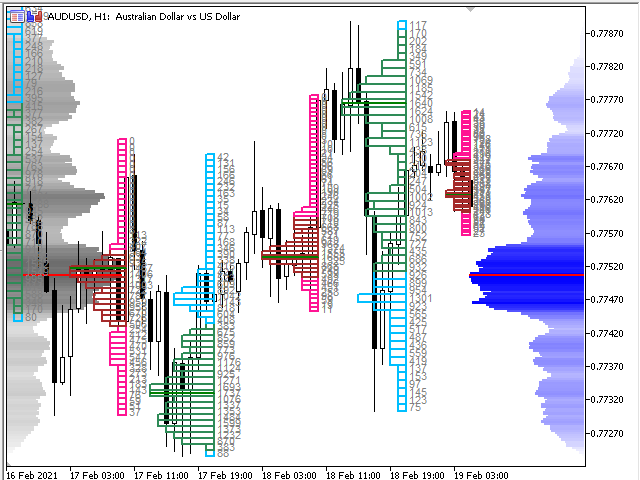
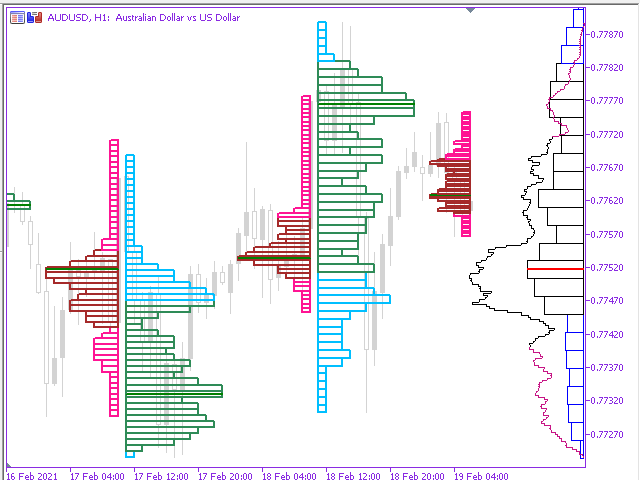
- Profile Display Mode: Lines/Solid/Gradient/Bars/Outline (as shown on the below)
- Profile Alignment: Right/Left
- Profile Periods: Session/Daily/Weekly/Monthly
- Show Volume Text
- Number of Price Steps: Number of horizontal divisions of profile
- VA Percentage: Percentage of Value Area
- Number of Profiles (Sessions)
- Session Start Time
- Session End Time
Side Profiles:
The “On‑Side” section includes several input parameters:
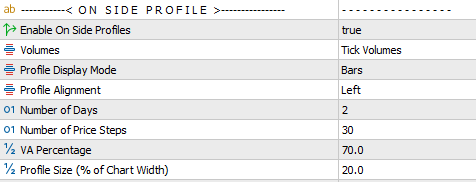
- Enable on side profiles
- Volumes: Tick or Real Volumes — If you choose to use real volumes, ensure that real volume data is available for the selected symbol.
- Profile Display Mode: Lines/Solid/Gradient/Bars/Outline (as shown on the above)
- Profile Alignment: Right/Left
- Number of Days: Number of days included in profile calculation
- Number of Price Steps: Number of horizontal divisions of profile
- VA Percentage: Percentage of Value Area
- Profile Size (% of Chart Width)
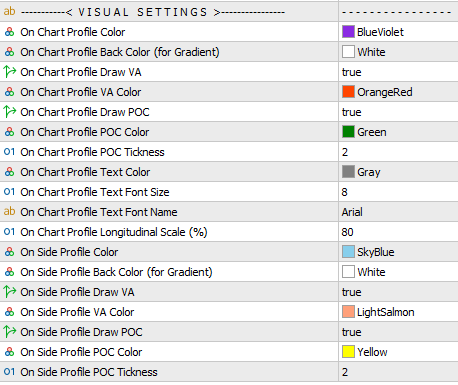
Visual Settings:
A comprehensive set of visual settings is available, allowing you to adjust profile colors, size, thickness, and more.
Note:
If you want to display multiple sessions in a single day, show histograms on both the left and right sides of the chart, or overlay two or more histograms at once, simply attach additional instances of the indicator to the chart with different settings.
About VPO Profile:
General Usage of VPO Profile:
Volume Distribution Analysis
VPO Profile shows how much trading volume occurred at each price level. Instead of just looking at candlestick OHLC data, traders can see where the market invested the most energy. This helps identify “fair value” zones versus “rejection” zones.
Support & Resistance Mapping
High‑volume clusters often act as strong support or resistance. By visualizing these levels, traders can anticipate where price is likely to stall, reverse, or break out.
Value Area (VA) & Point of Control (POC)
The indicator automatically calculates the Value Area (where 70% of volume is concentrated) and the Point of Control (the single price with the highest traded volume). These are critical levels for volume‑based strategies.
Session & Multi‑Day Profiles
Traders can analyze volume distribution by session, daily, weekly, or monthly periods. This flexibility allows intraday scalpers, swing traders, and long‑term investors to all benefit from the same tool.
Benefits of Using VPO Profile:
Clarity in Market Structure
Instead of guessing where the market is balanced or imbalanced, VPO Profile makes it visible. Traders can instantly see where price acceptance occurs.
Improved Trade Entries & Exits
By aligning trades with VA and POC levels, entries become more precise and exits more strategic. This reduces noise and increases confidence.
Risk Management
Knowing where the bulk of trading volume sits helps set logical stop‑loss and take‑profit levels. Traders avoid placing stops in “obvious” zones where liquidity hunts occur.
Example Scenarios:
Intraday Trading: A trader sees price approaching yesterday’s POC. They anticipate strong reaction and prepare for a scalp.
Swing Trading: Weekly VPO shows a high‑volume node acting as resistance. The trader waits for a breakout confirmation before entering.
Risk Control: Stops are placed just outside the Value Area, reducing the chance of being caught in false moves.
Buffers for Developers:
Developers can integrate the available buffers into custom dashboards, indicators, or Expert Advisors. The following table lists the buffer numbers along with their corresponding contents.
| Buffer Index | Shift Value | Description |
|---|---|---|
| 0 | 0 ~ N-1 | Prices of Latest On-Chart Profile |
| 1 | 0 ~ N-1 | Equivalent Volumes of Latest On-Chart Profile |
| 2 | 0 ~ N-1 | Prices of Latest On-Side Profile |
| 3 | 0 ~ N-1 | Equivalent Times of Latest On-Side Profile |
| 4 | 0 | POC of Latest On-Chart Profile |
| 5 | 0 | VAL of Latest On-Chart Profile |
| 6 | 0 | VAH of Latest On-Chart Profile |
| 7 | 0 | POC of Latest On-Side Profile |
| 8 | 0 | VAL of Latest On-Side Profile |
| 9 | 0 | VAH of Latest On-Side Profile |
Notes :
N represents the number of price steps, which defines the accuracy of the profile.
Only the buffers from the most recent profile are available.
Examples and Code Snippets:
for( i=0; i<N; i++)
{
    VPO_onChart_Price[i]=iCustom(Symbol(),Period(),"VPO Profile MT4",.....inputs......,0,i);
    VPO_onChart_Volume[i]=iCustom(Symbol(),Period(),"VPO Profile MT4",.....inputs......,1,i);
    VPO_onSide_Price[i]=iCustom(Symbol(),Period(),"VPO Profile MT4",.....inputs......,2,i);
    VPO_onSide_Volume[i]=iCustom(Symbol(),Period(),"VPO Profile MT4",.....inputs......,3,i);
}
VPO_onChart_POC=iCustom(Symbol(),Period(),"VPO Profile MT4",.....inputs......,4,0);
VPO_onChart_VAL=iCustom(Symbol(),Period(),"VPO Profile MT4",.....inputs......,5,0);
VPO_onChart_VAH=iCustom(Symbol(),Period(),"VPO Profile MT4",.....inputs......,6,0);
VPO_onSide_POC=iCustom(Symbol(),Period(),"VPO Profile MT4",.....inputs......,7,0);
VPO_onSide_VAL=iCustom(Symbol(),Period(),"VPO Profile MT4",.....inputs......,8,0);
VPO_onSide_VAH=iCustom(Symbol(),Period(),"VPO Profile MT4",.....inputs......,9,0);int handleVPO=iCustom(Symbol(),Period(),"VPO Profile MT5",.....inputs......);
if( handleVPO==INVALID_HANDLE ) Print("Invalid Handle for Indicator. Err : ",GetLastError());
int nbuf;
nbuf=CopyBuffer(handleVPO,0,0,N,VPO_onChart_Price);
if( nbuf!=N ) Print("Copy Buffer Err : ",GetLastError());
nbuf=CopyBuffer(handleVPO,1,0,N,VPO_onChart_Volume);
if( nbuf!=N ) Print("Copy Buffer Err : ",GetLastError());
nbuf=CopyBuffer(handleVPO,2,0,N,VPO_onSide_Price);
if( nbuf!=N ) Print("Copy Buffer Err : ",GetLastError());
nbuf=CopyBuffer(handleVPO,3,0,N,VPO_onSide_Volume);
if( nbuf!=N ) Print("Copy Buffer Err : ",GetLastError());
nbuf=CopyBuffer(handleVPO,4,0,1,VPO_onChart_POC);
if( nbuf!=1 ) Print("Copy Buffer Err : ",GetLastError());
nbuf=CopyBuffer(handleVPO,5,0,1,VPO_onChart_VAL);
if( nbuf!=1 ) Print("Copy Buffer Err : ",GetLastError());
nbuf=CopyBuffer(handleVPO,6,0,1,VPO_onChart_VAH);
if( nbuf!=1 ) Print("Copy Buffer Err : ",GetLastError());
nbuf=CopyBuffer(handleVPO,7,0,1,VPO_onSide_POC);
if( nbuf!=1 ) Print("Copy Buffer Err : ",GetLastError());
nbuf=CopyBuffer(handleVPO,8,0,1,VPO_onSide_VAL);
if( nbuf!=1 ) Print("Copy Buffer Err : ",GetLastError());
nbuf=CopyBuffer(handleVPO,9,0,1,VPO_onSide_VAH);
if( nbuf!=1 ) Print("Copy Buffer Err : ",GetLastError()); Need Help?
Here are some helpful resources. If you have questions or need assistance, feel free to contact us. You can submit a support ticket or leave a comment. we’ll respond as quickly as possible.
Screenshots
Pricing
New Offer Every 6 Hours up to 50%. Follow.
Testing is free. How to do?

6 Months
6 Months of unlimited use
3 Accounts Activation
Full Support
Free Updates
$ 30.00

1 Year
1 Year of unlimited use
4 Accounts Activation
Full Support
Free Updates
$ 45.00

Lifetime
Unlimited use, forever
5 Accounts Activation
VIP Support
Free Updates
$ 60.00
 to be a light for all traders.
This looks complicated.
It may feel advanced at first, but once you understand how volume clusters work, it becomes intuitive. The included guide helps you get started quickly.
I stopped using it. I think other indicators can be better. I am searching others.
The indicator is powerful, but beginners might find the settings overwhelming at first.
It made volume analysis clear. I can see support and resistance zones instantly.
This indicator gave me the confidence to trust volume levels instead of guessing with candles. Thanks.
Too many settings. I just wanted something simple.
We provided many options and settings. But the indicator is easy-to-use. You can leave all of them as default and only change your desired settings.
Does VPO Profile require special installation?
No. It installs like any other MetaTrader indicator.
VPO Profile makes volume analysis simple. I can finally see where the market is strongest.
As a developer, I appreciate the buffer integration. It allows me to build custom dashboards and EAs around VPO Profile.
Hello. Can I attach more than one VPO Profile to a chart?
Yes. You can add multiple instances with different settings to compare overlapping sessions or timeframes.
I like the concept of VPO Profile, but I found the side profiles less useful for my intraday trading. They cluttered my chart, and I ended up disabling them. Still, the on‑chart profiles are solid and the POC levels are accurate.
You can disable any profile individually. A separate disable option is available for each one, allowing you to turn off any profile you don’t want to use.
I like the accuracy of the POC levels, but the gradient display mode felt cluttered on my charts. After experimenting, I settled on the solid mode, which works better for me.
It is not displaying anything on chart after attaching. What is the problem?
Hi, please check the log report in your terminal’s Experts tab. That information will help identify the issue. If you can’t find anything useful there, send me a screenshot and I’ll assist you further.
Solved. That was my fault.
Thank you for your support.
I have a better description in a word :
VPO is the full picture of Volume and Price.
Does VPO Profile slow down MetaTrader?
No. It’s optimized for performance and runs smoothly even with multiple overlapping profiles.
VPO Profile changed how I trade. I don’t just see candles anymore. I see where the market actually traded the most volume. I see the market’s heartbeat.
This is the closest thing to institutional Market Profile I’ve seen on MT4/MT5.
The comments section is now open. Feel free to share your feedback, reviews, questions, and personal experience with the product. You can also interact with other users and join the discussion. Our support team is active there as well and will respond whenever assistance is needed.